

Behavior of Early Warnings near the Critical Temperature in the Two-Dimensional Ising Model
- PMID: 26103513
- PMCID: PMC4477971
- DOI: 10.1371/journal.pone.0130751
Behavior of Early Warnings near the Critical Temperature in the Two-Dimensional Ising Model
Abstract
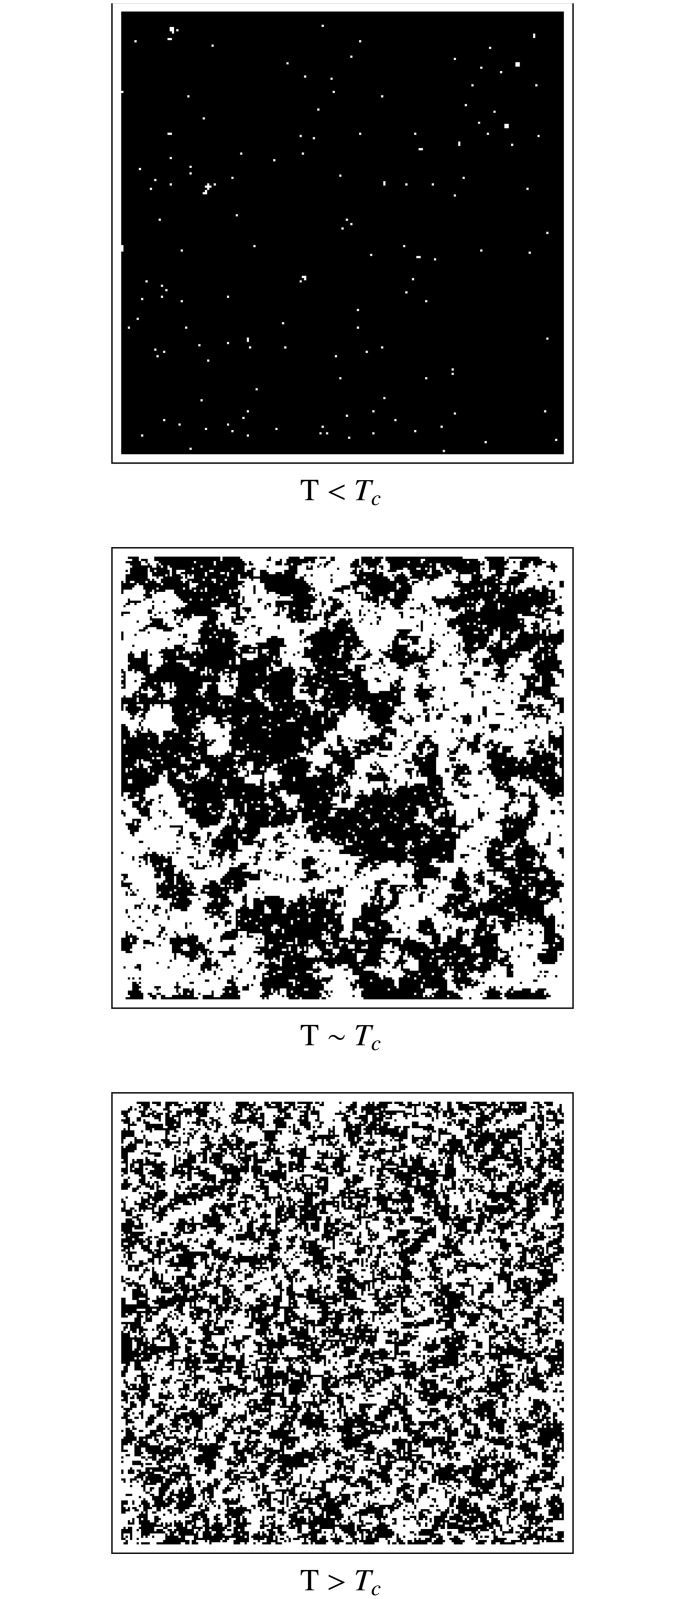
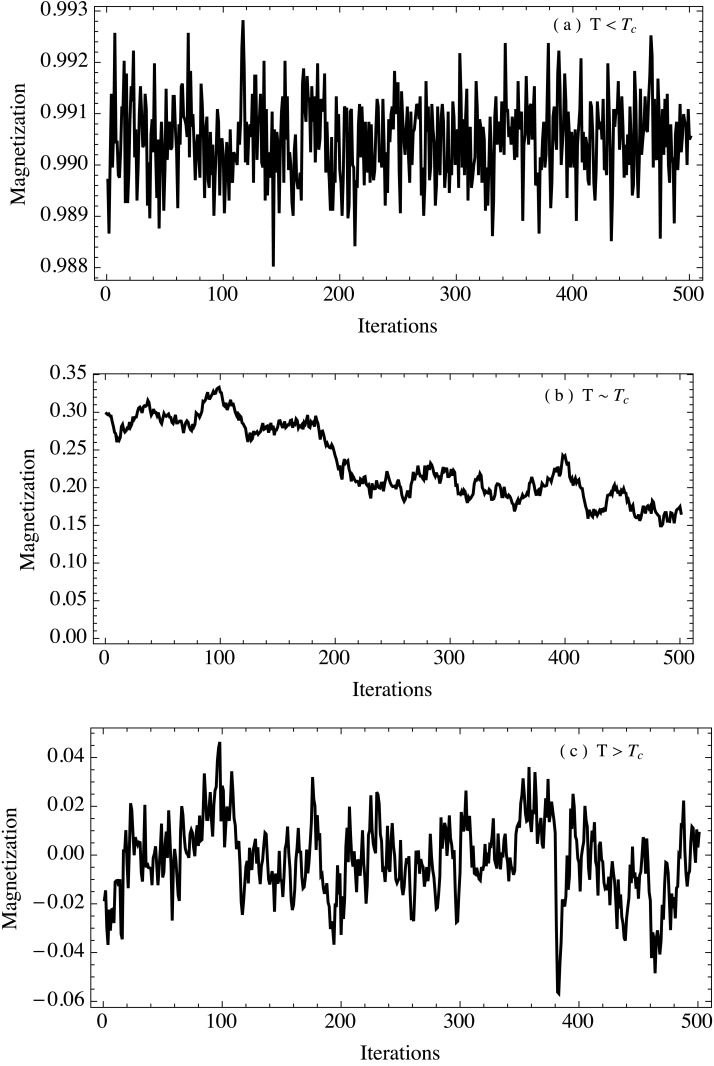
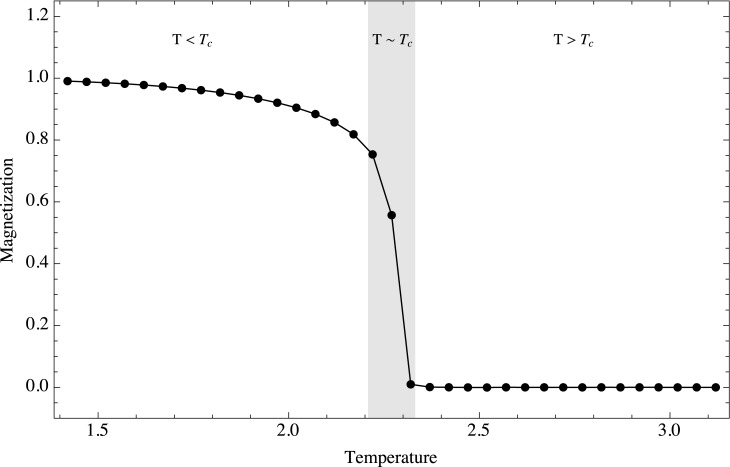
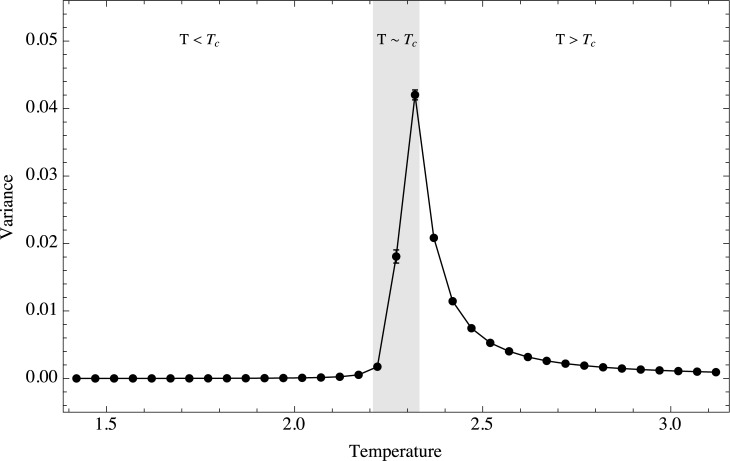
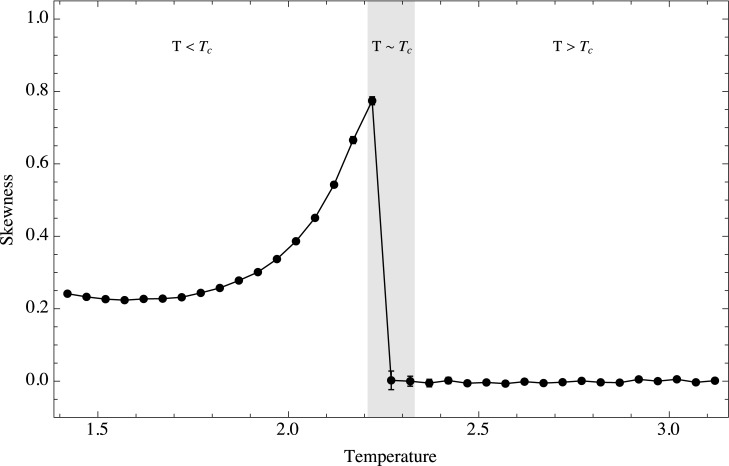
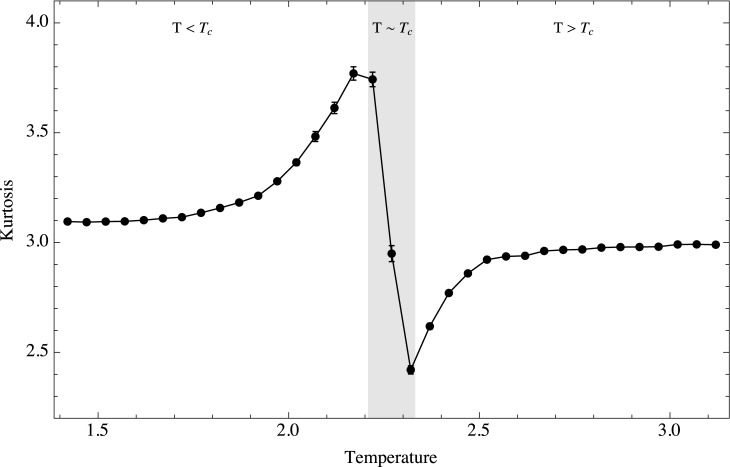
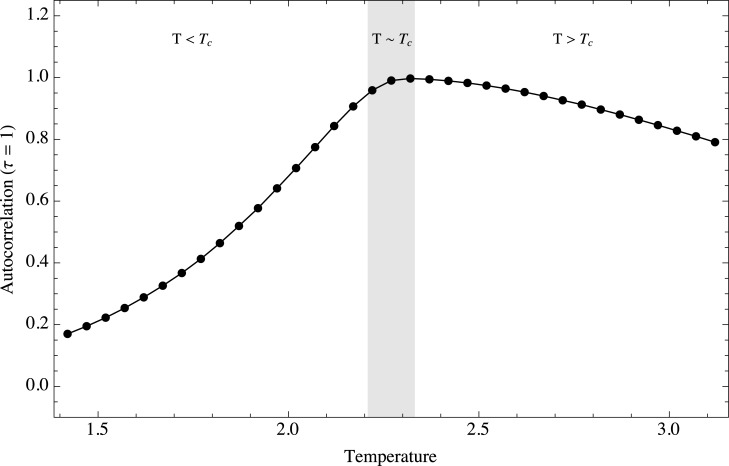
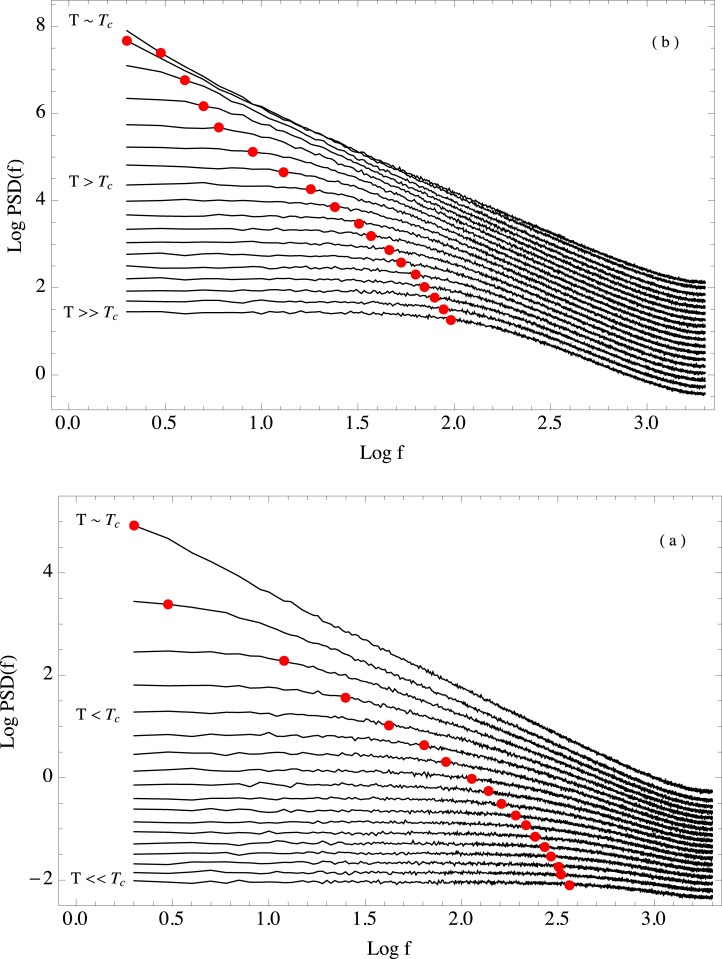
Among the properties that are common to complex systems, the presence of critical thresholds in the dynamics of the system is one of the most important. Recently, there has been interest in the universalities that occur in the behavior of systems near critical points. These universal properties make it possible to estimate how far a system is from a critical threshold. Several early-warning signals have been reported in time series representing systems near catastrophic shifts. The proper understanding of these early-warnings may allow the prediction and perhaps control of these dramatic shifts in a wide variety of systems. In this paper we analyze this universal behavior for a system that is a paradigm of phase transitions, the Ising model. We study the behavior of the early-warning signals and the way the temporal correlations of the system increase when the system is near the critical point.
Conflict of interest statement
Figures
Similar articles
-
Tendency toward crossover of the effective susceptibility exponent from its doubled Ising value to its doubled mean-field value near a double critical point.J Chem Phys. 2008 Oct 7;129(13):134506. doi: 10.1063/1.2987344. J Chem Phys. 2008. PMID: 19045104
-
Nonequilibrium phase transition in an exactly solvable driven Ising model with friction.Phys Rev E Stat Nonlin Soft Matter Phys. 2009 Dec;80(6 Pt 1):061138. doi: 10.1103/PhysRevE.80.061138. Epub 2009 Dec 30. Phys Rev E Stat Nonlin Soft Matter Phys. 2009. PMID: 20365149
-
Universality of the Ising and the S=1 model on Archimedean lattices: a Monte Carlo determination.Phys Rev E Stat Nonlin Soft Matter Phys. 2012 Mar;85(3 Pt 1):031146. doi: 10.1103/PhysRevE.85.031146. Epub 2012 Mar 29. Phys Rev E Stat Nonlin Soft Matter Phys. 2012. PMID: 22587077
-
Monte Carlo simulations of the clean and disordered contact process in three dimensions.Phys Rev E Stat Nonlin Soft Matter Phys. 2012 Nov;86(5 Pt 1):051137. doi: 10.1103/PhysRevE.86.051137. Epub 2012 Nov 30. Phys Rev E Stat Nonlin Soft Matter Phys. 2012. PMID: 23214768
-
Perspectives on a Few Puzzles in Phase Transformations: When Should the Farthest Reach the Earliest?Langmuir. 2023 Aug 8;39(31):10715-10723. doi: 10.1021/acs.langmuir.3c00668. Epub 2023 Jul 27. Langmuir. 2023. PMID: 37499235 Review.
Cited by
-
Critical transitions in degree mixed networks: A discovery of forbidden tipping regions in networked spin systems.PLoS One. 2022 Nov 18;17(11):e0277347. doi: 10.1371/journal.pone.0277347. eCollection 2022. PLoS One. 2022. PMID: 36399485 Free PMC article.
-
Enhancement of early warning properties in the Kuramoto model and in an atrial fibrillation model due to an external perturbation of the system.PLoS One. 2017 Jul 28;12(7):e0181953. doi: 10.1371/journal.pone.0181953. eCollection 2017. PLoS One. 2017. PMID: 28753631 Free PMC article.
-
The Role of the Autonomic Nervous System on Cardiac Rhythm during the Evolution of Diabetes Mellitus Using Heart Rate Variability as a Biomarker.J Diabetes Res. 2019 May 9;2019:5157024. doi: 10.1155/2019/5157024. eCollection 2019. J Diabetes Res. 2019. PMID: 31211146 Free PMC article.
-
Modular tipping points: How local network structure impacts critical transitions in networked spin systems.PLoS One. 2023 Nov 14;18(11):e0292935. doi: 10.1371/journal.pone.0292935. eCollection 2023. PLoS One. 2023. PMID: 37963138 Free PMC article.
-
Analysis of properties of Ising and Kuramoto models that are preserved in networks constructed by visualization algorithms.PLoS One. 2019 Sep 6;14(9):e0221674. doi: 10.1371/journal.pone.0221674. eCollection 2019. PLoS One. 2019. PMID: 31490949 Free PMC article.
References
-
- Prokopenko M, Boschetti F, Ryan AJ. An information-theoretic primer on complexity, self-organization, and emergence. Complexity. 2009;15(1):11–28. 10.1002/cplx.20249 - DOI
-
- Gershenson C, Fernández N. Complexity and information: Measuring emergence, self-organization, and homeostasis at multiple scales. Complexity. 2012;18(2):29–44. 10.1002/cplx.21424 - DOI
Publication types
MeSH terms
LinkOut - more resources
Full Text Sources
Other Literature Sources
