. 2015 Sep:86:23-31.
doi: 10.1016/j.yjmcc.2015.06.012. Epub 2015 Jun 21.

Altered distribution of ICa impairs Ca release at the t-tubules of ventricular myocytes from failing hearts

Affiliations

Altered distribution of ICa impairs Ca release at the t-tubules of ventricular myocytes from failing hearts

Simon M Bryant et al. J Mol Cell Cardiol. 2015 Sep.

Abstract

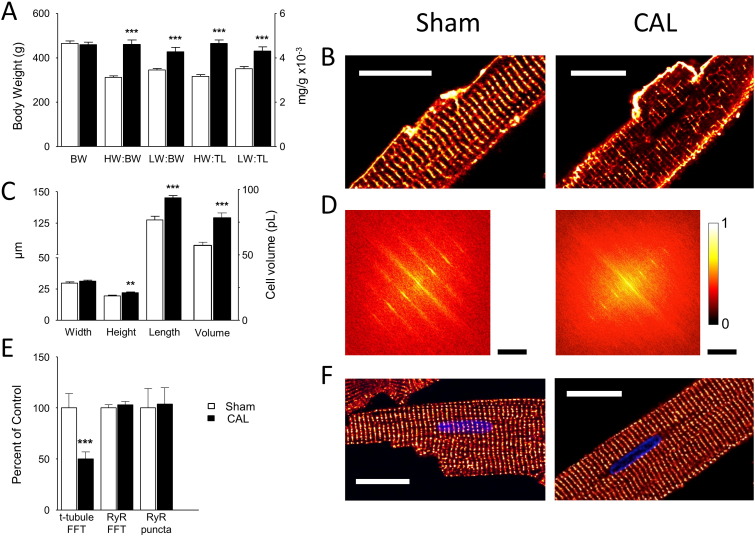
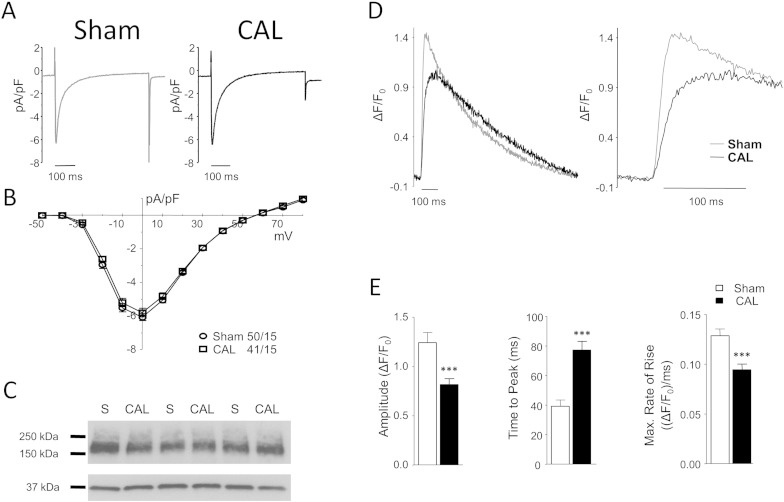
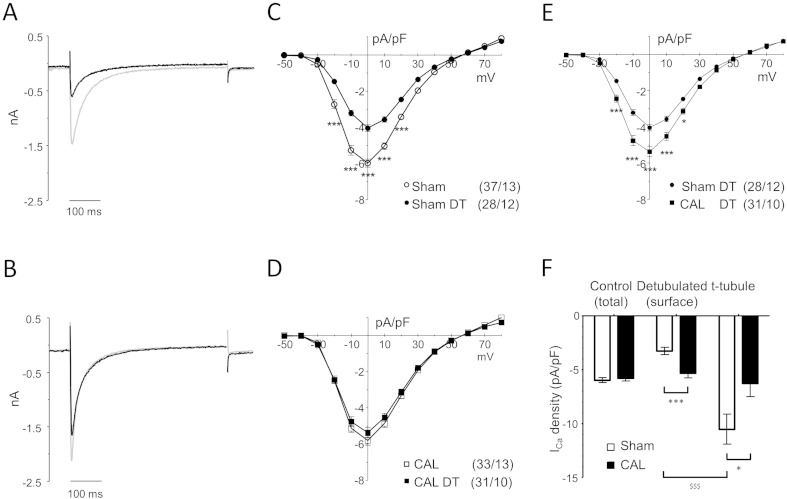
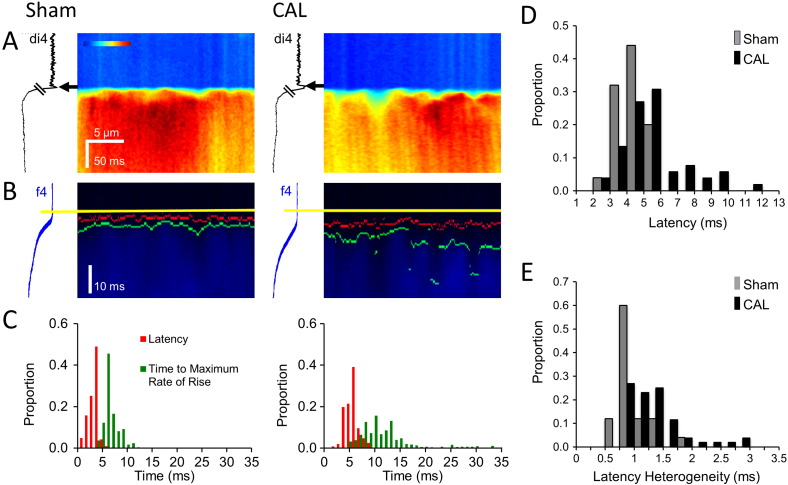
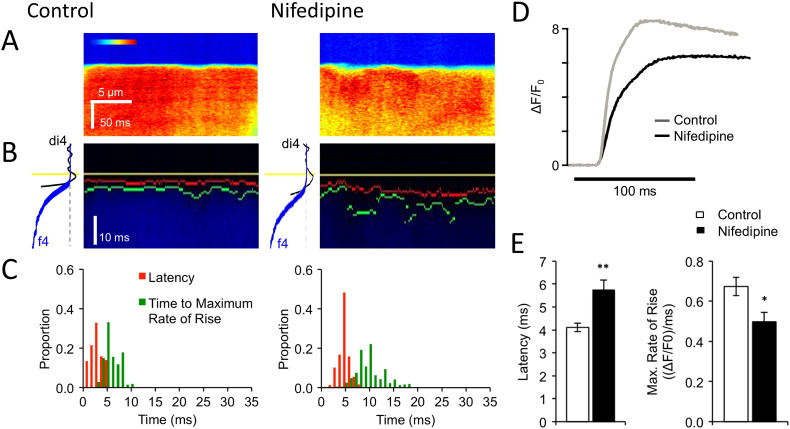
In mammalian cardiac ventricular myocytes, Ca influx and release occur predominantly at t-tubules, ensuring synchronous Ca release throughout the cell. Heart failure is associated with disrupted t-tubule structure, but its effect on t-tubule function is less clear. We therefore investigated Ca influx and release at the t-tubules of ventricular myocytes isolated from rat hearts ~18weeks after coronary artery ligation (CAL) or corresponding Sham operation. L-type Ca current (ICa) was recorded using the whole-cell voltage-clamp technique in intact and detubulated myocytes; Ca release at t-tubules was monitored using confocal microscopy with voltage- and Ca-sensitive fluorophores. CAL was associated with cardiac and cellular hypertrophy, decreased ejection fraction, disruption of t-tubule structure and a smaller, slower Ca transient, but no change in ryanodine receptor distribution, L-type Ca channel expression, or ICa density. In Sham myocytes, ICa was located predominantly at the t-tubules, while in CAL myocytes, it was uniformly distributed between the t-tubule and surface membranes. Inhibition of protein kinase A with H-89 caused a greater decrease of t-tubular ICa in CAL than in Sham myocytes; in the presence of H-89, t-tubular ICa density was smaller in CAL than in Sham myocytes. The smaller t-tubular ICa in CAL myocytes was accompanied by increased latency and heterogeneity of SR Ca release at t-tubules, which could be mimicked by decreasing ICa using nifedipine. These data show that CAL decreases t-tubular ICa via a PKA-independent mechanism, thereby impairing Ca release at t-tubules and contributing to the altered excitation-contraction coupling observed in heart failure.

Keywords: Ca imaging; Heart failure; t-tubules.


Figures

Fig. 1
Fig. 1
Effects of CAL on cardiac and myocyte morphology. A: Mean (± SEM) body weight (left axis), and heart weight (HW) and lung weight (LW) relative to body weight (BW) and tibia length (TL) in Sham (open bars, n = 21) and CAL (filled bars, n = 22) animals. B: Confocal images of mid-section slices from representative Sham (left) and CAL (right) myocytes stained with di-8-ANEPPS; scale bar 20 μm. C: Mean (± SEM) cell dimensions (left axis) and volume (right axis) of myocytes isolated from Sham (open bars, n = 48/4) and CAL (filled bars, n = 58/4) myocytes. D: 2D FFTs of the cells shown in B (cropped to half their original size to show the central portion comprising 0 to ~ 4th harmonics). FFT values are normalized to the peak value and scaled (color bar on right). The scale bars show 0.94/μm for both Sham and CAL. E: Mean (± SEM) t-tubule power (Sham, n = 48; CAL, n = 58), RyR power and density of RyR clusters in Sham (open bars, n = 11) and CAL (filled bars, n = 10) myocytes, normalized to mean Sham data. **p < 0.01, ***p < 0.001 vs Sham. F: Representative confocal images of RyR labeling in single Sham (left) and CAL (right) myocytes, scale bar 20 μm.
Fig. 2
Fig. 2
Effect of CAL on ICa, LTCC expression and the systolic Ca transient. A: Representative L-type Ca currents (ICa) recorded at 0 mV from Sham (left) and CAL (right) myocytes. B: Mean (± SEM) ICa density-voltage relations from Sham (circles, n = 50/15) and CAL (squares, n = 41/15) myocytes. C: Representative Western blots of Sham (S) and CAL lysates probed with antibodies against LTCC (top) or GAPDH (bottom). D: Representative whole-cell Ca transients from Sham (grey line) and CAL (black line) myocytes during field stimulation (left); the right panel shows the early rise on an expanded time scale. E: Mean (± SEM) peak ΔF/F0, time to peak (TTP), and rate of rise (ΔF/F0.ms− 1) of the Ca transient in Sham (open bars, n = 10) and CAL (filled bars, n = 16) myocytes. ⁎⁎⁎p < 0.001 vs Sham.
Fig. 3
Fig. 3
Sub-cellular distribution of ICa in CAL myocytes. A, B: Representative recordings of ICa obtained at 0 mV from intact (grey line) and detubulated (DT; black line) Sham (A) and CAL (B) myocytes. C: Mean (± SEM) ICa density-voltage relations in intact (open circles, n = 37/13) and detubulated (filled circles, n = 28/12) Sham myocytes. D: Mean (± SEM) ICa density–voltage relations in intact (open squares, n = 33/13) and detubulated (filled squares, n = 31/10) CAL myocytes. E: Mean (± SEM) ICa density–voltage relations in detubulated Sham (filled circles) and CAL (filled squares) myocytes. F: Mean (± SEM) ICa densities at 0 mV in intact Sham (n = 37) and CAL (n = 33) myocytes, and mean (± SEM) surface sarcolemmal and t-tubular ICa densities following correction for incomplete detubulation, as described in the text. p < 0.05, ⁎⁎⁎p < 0.001 CAL vs Sham; $$$p < 0.001 surface vs t-tubule.
Fig. 4
Fig. 4
Effect of CAL on Ca release at t-tubules. A: Main panels show transverse line-scan images of Ca transients (field-stimulated at 0.1 Hz) recorded at a t-tubule in representative Sham (left) and CAL (right) myocytes; the traces to the left of each panel show average di-4-AN(F)EPPTEA (di4) fluorescence against time; arrows indicate the time of the t-tubule action potential. B: Traces shown in A on an expanded time scale. The start of the action potential is indicated by yellow lines, the start of the Ca transient by red lines, and the time of the maximum rate of rise of the Ca transient by green lines (see Methods); the traces to the left of each panel show average fluo-4 (f4) fluorescence against time. C: Histograms of latency (red) and time to maximum rate of rise (green) from the cells shown in A and B. D: Mean data for latency of Ca transient; Sham (grey bars; n = 25/4) had a mean latency of 3.3 ms, CAL (black bars; n = 54/6) had a mean latency of 5.5 ms; 4–7 Ca transients recorded from each myocyte. Bin size 1 ms. E: Mean data for heterogeneity of latency; Sham (grey bars; n = 25/4) and CAL (black bars; n = 54/6). Bin size 0.2 ms. See Table 2 for mean data.
Fig. 5
Fig. 5
Effect of nifedipine on Ca release. A: Main panels show transverse line-scan images of Ca transients (field stimulated at 0.1 Hz) recorded at a t-tubule in representative myocytes in the absence (left) and presence (right) of nifedipine. B: Traces shown in A on an expanded time scale. The start of the action potential is indicated by yellow lines, the start of the Ca transient by red lines, and the time of the maximum rate of rise of the Ca transient by green lines (see Methods); the traces to the left of each panel show average di4 (black) and f4 (blue) fluorescence against time. C: Histograms of latency (red) and time to maximum rate of rise (green) from the cell shown in A and B. See Table 2 for mean data. D. Representative whole-cell Ca transients in the absence (grey line) and presence (black line) of nifedipine during field stimulation. E. Mean (± SEM) latency and rate of rise (ΔF/F0/ms) of the whole-cell Ca transient in the absence (open bars, n = 12) and presence (filled bars, n = 12) of nifedipine. ⁎⁎⁎p < 0.001 vs Control.

References

    1. Bers D.M. Altered cardiac myocyte Ca regulation in heart failure. Physiology. 2006;21:380–387. - PubMed
    1. Jorgensen A.O., Shen A.C., Arnold W., McPherson P.S., Campbell K.P. The Ca2 + -release channel/ryanodine receptor is localized in junctional and corbular sarcoplasmic reticulum in cardiac muscle. J Cell Biol. 1993;120:969–980. - PMC - PubMed
    1. Soeller C., Cannell M.B. Examination of the transverse tubular system in living cardiac rat myocytes by 2-photon microscopy and digital image-processing techniques. Circ Res. 1999;84:266–275. - PubMed
    1. Chase A., Colyer J., Orchard C.H. Localised Ca channel phosphorylation modulates the distribution of L-type Ca current in cardiac myocytes. J Mol Cell Cardiol. 2010;49:121–131. - PubMed
    1. Kawai M., Hussain M., Orchard C.H. Excitation-contraction coupling in rat ventricular myocytes after formamide-induced detubulation. Am J Physiol. 1999;277:H603–H609. - PubMed

Publication types

MeSH terms

Substances