. 2015 Jun 24:6:7354.
doi: 10.1038/ncomms8354.

Grb2 monomer-dimer equilibrium determines normal versus oncogenic function

Affiliations

Grb2 monomer-dimer equilibrium determines normal versus oncogenic function

Zamal Ahmed et al. Nat Commun. .

Erratum in

Abstract

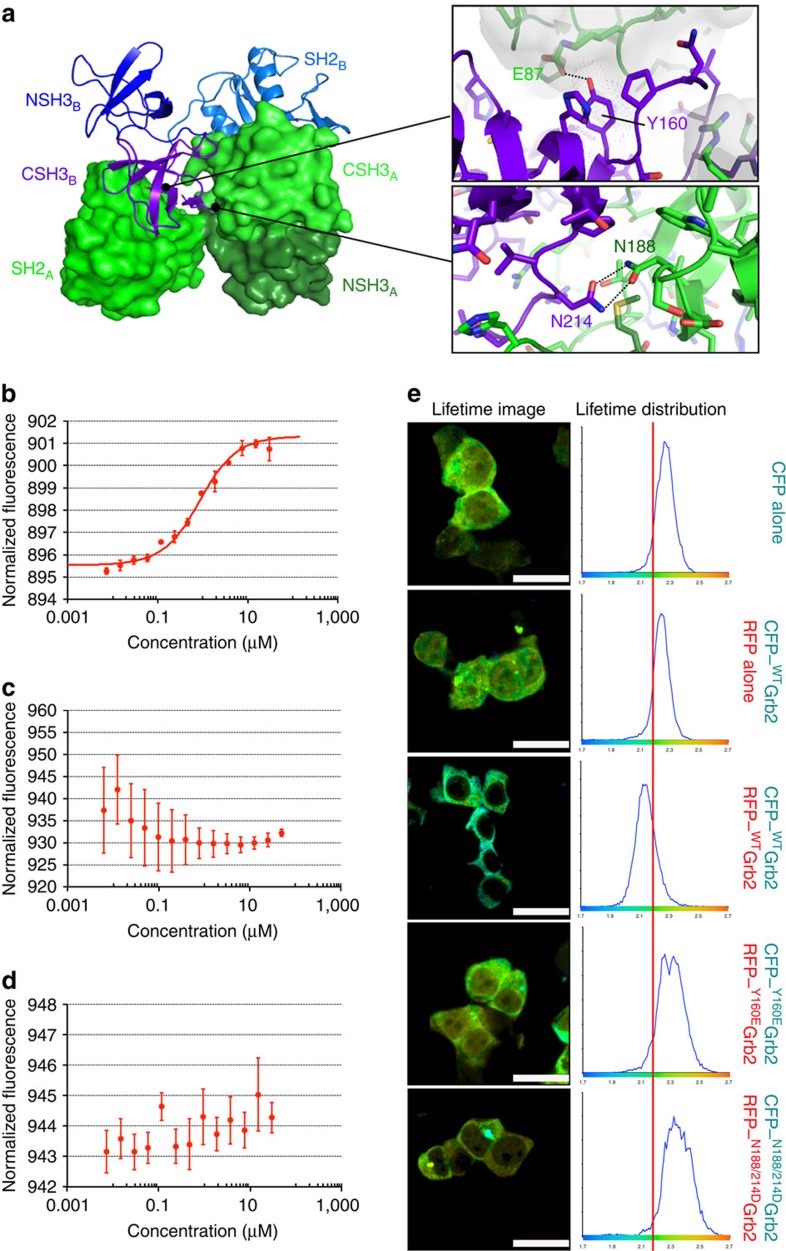
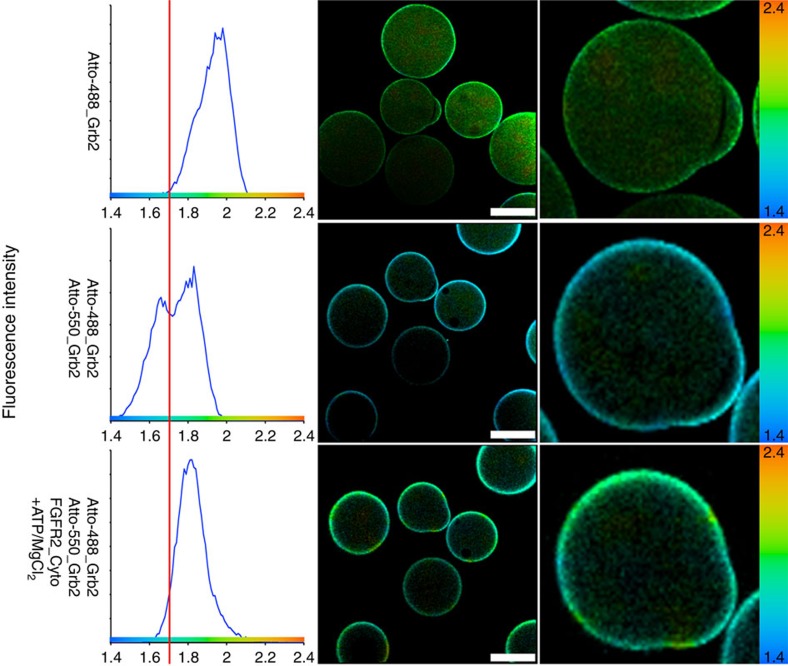
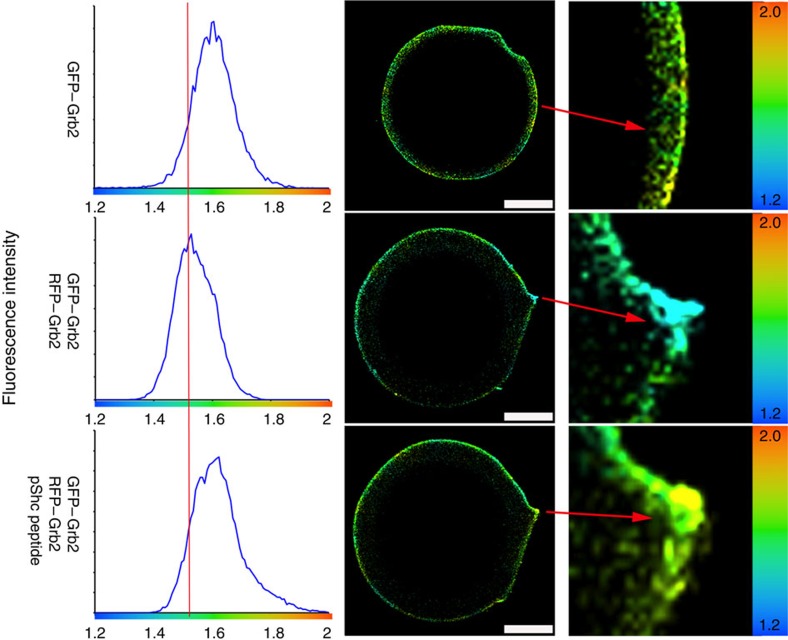
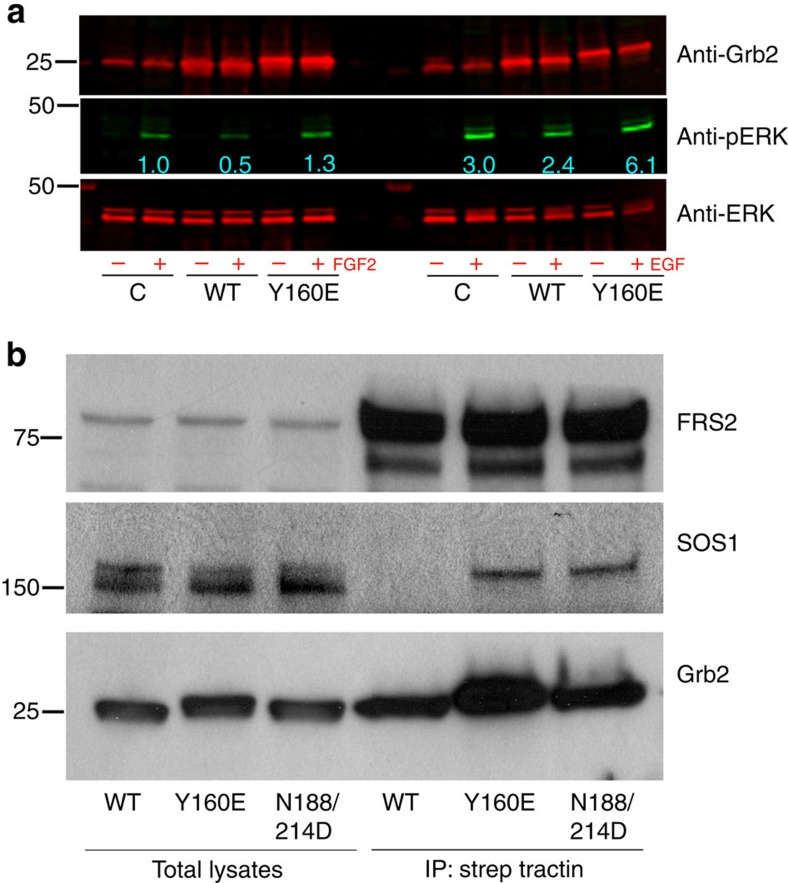
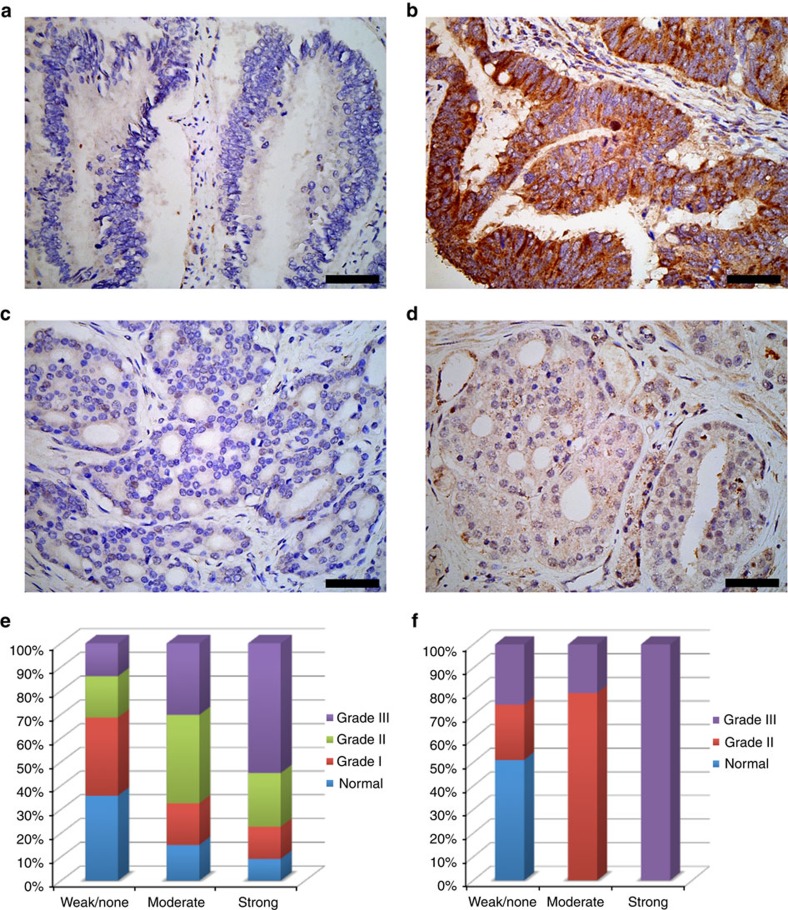
The adaptor protein growth factor receptor-bound protein 2 (Grb2) is ubiquitously expressed in eukaryotic cells and involved in a multitude of intracellular protein interactions. Grb2 plays a pivotal role in tyrosine kinase-mediated signal transduction including linking receptor tyrosine kinases to the Ras/mitogen-activated protein (MAP) kinase pathway, which is implicated in oncogenic outcome. Grb2 exists in a constitutive equilibrium between monomeric and dimeric states. Here we show that only monomeric Grb2 is capable of binding to SOS and upregulating MAP kinase signalling and that the dimeric state is inhibitory to this process. Phosphorylation of tyrosine 160 (Y160) on Grb2, or binding of a tyrosylphosphate-containing ligand to the SH2 domain of Grb2, results in dimer dissociation. Phosphorylation of Y160 on Grb2 is readily detectable in the malignant forms of human prostate, colon and breast cancers. The self-association/dissociation of Grb2 represents a switch that regulates MAP kinase activity and hence controls cancer progression.


Figures

Figure 1
Figure 1. In vitro and in vivoWTGrb2 form dimers.
(a) Homodimer with individual Grb2 protomers of the dimer depicted using surface (green) and ribbon (blue/purple) representations (derived from PDB 1GRI). Individual SH2 and SH3 domains of the protomers are differentially coloured and labelled. Zoomed box (top)—Y160 of one protomer (purple) is buried in the dimer interface, packing against the CSH3 domain and hydrogen bonding with E87 of the other protomer chain (green). Zoomed box (bottom)—hydrogen bonded Asn188 (green) and Asn214 (purple) in the dimer interface. (b) Grb2 dimerization measured by MST. Unlabelled WTGrb2 protein (7.3 nM to 30 μM) was titrated into a fixed concentration of labelled Grb2 (100 nM). The data for thermophoresis was recorded at 20 °C using the blue LED at 20% and IR-Laser at 40%. The isotherm derived from the raw data and fitted according to the law of mass action to yield an apparent Kd dimer of 0.76±0.20 μM. (c) The data points representing the MST results of the Y160E mutant, which show a scattered distribution and unsuitable for fitting. (d) The thermophoresis results of the N188/214D mutant, as with Y160E the data is unsuitable for fitting analysis. (e) FLIM of Grb2 dimerization in mammalian cells through FRET measurements. CFP- and RFP-tagged wild-type or the Grb2 mutants together with controls were co-transfected in HEK293T cells as indicated on the figure. The results show a clear shortening of the average lifetime distribution for fluorophore in cells expressing the WTGrb2. This is due to FRET between the CFP–Grb2 and RFP–Grb2. The Y160E and N188/214D mutants on the other hand show an average lifetime distribution comparable to the controls indicating no FRET. Scale bar, 25 μm.
Figure 2
Figure 2. Grb2 tyrosine phosphorylation disrupts dimerization.
FRET between Atto488–Grb2 and Atto550–Grb2 measured with FLIM. The panels on the right show the distribution of the average fluorescence lifetime. The middle image is the representation of the measured lifetime as a false colour map. On the right hand side are zoomed images of a bead with a characteristic imperfection. The mean lifetime of Atto488–Grb2 is centred at ∼1.9 ns. The addition of the acceptor Atto550–Grb2 leads to an apparent left shift in the average lifetime. This is clear from the appearance of a new peak at ∼1.6 ns as a result of FRET between Atto488–Grb2 and Atto550–Grb2. Addition of FGFR2 has no effect on the apparent average lifetime. However, further addition of ATP/MgCl2 reversed the average lifetime to 1.9 ns providing evidence for the disruption of FRET and hence the disruption of dimerization on phosphorylation of Grb2. Scale bars, 50 μm.
Figure 3
Figure 3. Binding of phosphotyrosine by Grb2-SH2 domain leads to dissociation.
smFLIM shows Grb2 dimerization is disrupted upon phospho-Shc peptide binding by its SH2 domain. GFP-tagged Grb2 immobilized on GFP-trap beads were imaged in 20 mM Tris-HCl, 50 mM NaCl at pH 8.0. The reference average lifetime in the absence of acceptor is 1.6 ns. RFP–Grb2 was added and allowed to form complex for 1 h and the lifetime of GFP–Grb2 shortens as indicated by left-shifted peak with average lifetime centred on 1.5 ns clearly indicating that FRET has occurred. Phospho-Shc peptide (10 μM) containing the pYxN motif was then added, allowed to equilibrate for an hour and the fluorescence lifetime was measured. Addition of the phospho-Shc peptide restores the lifetime to the control values obtained in the absence of acceptor. This clearly shows that the phospho-Shc peptide disrupts dimerization of Grb2. The zoomed image of the bead (right hand column) shows lifetime values mapped to a false colour image. The change in fluorescence lifetime as a function of colour is highly noticeable. The data presented here was consistently reproduced in three independent experiments. Scale bars, 10 μm.
Figure 4
Figure 4. Dimeric Grb2 inhibits while monomeric Grb2 promotes MAP kinase activity.
(a) Stable HEK293T cells overexpressing FGFR2–GFP (as control, C) and strep-tagged wild-type Grb2 or the dimerization-defective Y160E mutant were stimulated with 50 ng/ml FGF2 or EGF for 15 and 5 min, respectively. Cell-lysates were analysed for phospho-ERK (pERK), total ERK and Grb2 expression levels using specific antibody and Odyssey infra-red imaging. (b) HEK293T cells overexpressing FGFR2–GFP with indicated strep-tagged Grb2 in serum were lysed and subjected to strep-tactin affinity purification. The resulting co-precipitated complexes along with input cell-lysates were analysed for SOS and FRS2 binding using respective antibody. The immunoblot was also re-probed for Grb2 as a loading control. The data presented are representative of three independent experiments.
Figure 5
Figure 5. Analysis of human colon and prostate cancer tissues for Y160 phosphorylation.
Using the pY160 antibody IHC was performed on multi-tumours tissue microarray of 95 samples with 40 types of tumours from 27 organs. (a) Weak or no staining for Grb2 Y160 phosphorylation in grade I colon adenocarcinoma. (b) Strong staining for Grb2 Y160 phosphorylation in grade III colon adenocarcinoma. (c) Weak or no staining for Grb2 Y160 phosphorylation in grade II prostate adenocarcinoma. (d) Moderate staining for Grb2 Y160 phosphorylation in grade III prostate adenocarcinoma. A significant increase in the level of pY160 phosphorylation is seen in higher-grade tumour samples. The bars on a–d correspond to 50 μm. (e) The pY160 antibody staining patterns for 118 colon cancer tissue samples. The samples were scored according to the pY160 staining as weak or none, moderate and strong and plotted against tumour grade as percentage. Data compiled from normal tissues (n=42), and tumours grade I (n=28), grade II (n=34) and grade III (n=14) which shows a progressive increase in the strength of pY160 staining with higher tumour grade. (f) The pY160 antibody staining patterns for 42 clinical prostate cancer tissue samples with the relative staining patterns for pY160 antibody. As above, samples were scored, sorted and plotted against tumour grade as percentage. Normal and/or hyperplasic tissue (n=15), tumour grade II (n=13) and grade III (n=14). Here the pY160 staining is only associated with malignant tumours and intensity of staining is increased in tumours with a higher level of malignancy.

References

    1. Rozakis-Adcock M. et al. Association of the Shc and Grb2/Sem5 SH2-containing proteins is implicated in activation of the Ras pathway by tyrosine kinases. Nature 360, 689–692 (1992). - PubMed
    1. Cheng S. Y., Sun G., Schlaepfer D. D. & Pallen C. J. Grb2 promotes integrin-induced focal adhesion kinase (FAK) autophosphorylation and directs the phosphorylation of protein tyrosine phosphatase alpha by the Src-FAK kinase complex. Mol. Cell. Biol. 34, 348–361 (2014). - PMC - PubMed
    1. Chu J., Liu Y., Koretzky G. A. & Durden D. L. SLP-76-Cbl-Grb2-Shc interactions in FcgammaRI signaling. Blood 92, 1697–1706 (1998). - PubMed
    1. Myers M. G. Jr. et al. Role of IRS-1-GRB-2 complexes in insulin signaling. Mol. Cell. Biol. 14, 3577–3587 (1994). - PMC - PubMed
    1. Ong S. H., Dilworth S., Hauck-Schmalenberger I., Pawson T. & Kiefer F. ShcA and Grb2 mediate polyoma middle T antigen-induced endothelial transformation and Gab1 tyrosine phosphorylation. EMBO J. 20, 6327–6336 (2001). - PMC - PubMed