. 2015 Jun 24:13:146.
doi: 10.1186/s12916-015-0382-8.

Asymptomatic transmission and the resurgence of Bordetella pertussis

Affiliations

Asymptomatic transmission and the resurgence of Bordetella pertussis

Benjamin M Althouse et al. BMC Med. .

Abstract

Background: The recent increase in whooping cough incidence (primarily caused by Bordetella pertussis) presents a challenge to both public health practitioners and scientists trying to understand the mechanisms behind its resurgence. Three main hypotheses have been proposed to explain the resurgence: 1) waning of protective immunity from vaccination or natural infection over time, 2) evolution of B. pertussis to escape protective immunity, and 3) low vaccine coverage. Recent studies have suggested a fourth mechanism: asymptomatic transmission from individuals vaccinated with the currently used acellular B. pertussis vaccines.

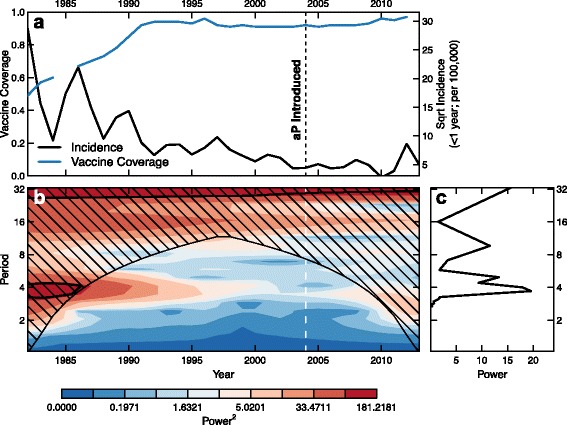
Methods: Using wavelet analyses of B. pertussis incidence in the United States (US) and United Kingdom (UK) and a phylodynamic analysis of 36 clinical B. pertussis isolates from the US, we find evidence in support of asymptomatic transmission of B. pertussis. Next, we examine the clinical, public health, and epidemiological consequences of asymptomatic B. pertussis transmission using a mathematical model.

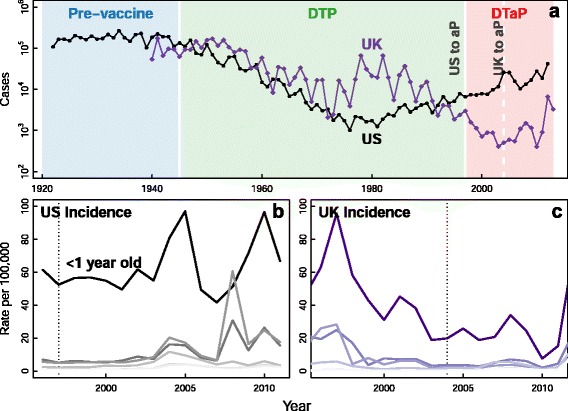
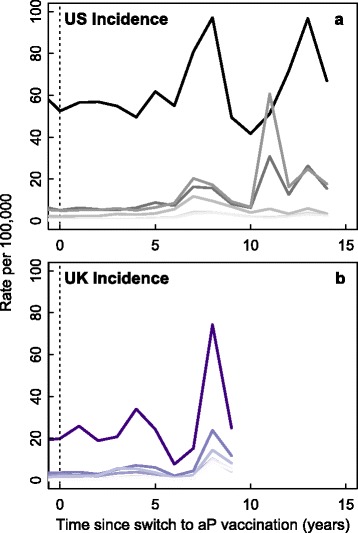
Results: We find that: 1) the timing of changes in age-specific attack rates observed in the US and UK are consistent with asymptomatic transmission; 2) the phylodynamic analysis of the US sequences indicates more genetic diversity in the overall bacterial population than would be suggested by the observed number of infections, a pattern expected with asymptomatic transmission; 3) asymptomatic infections can bias assessments of vaccine efficacy based on observations of B. pertussis-free weeks; 4) asymptomatic transmission can account for the observed increase in B. pertussis incidence; and 5) vaccinating individuals in close contact with infants too young to receive the vaccine ("cocooning" unvaccinated children) may be ineffective.

Conclusions: Although a clear role for the previously suggested mechanisms still exists, asymptomatic transmission is the most parsimonious explanation for many of the observations surrounding the resurgence of B. pertussis in the US and UK. These results have important implications for B. pertussis vaccination policy and present a complicated scenario for achieving herd immunity and B. pertussis eradication.


Figures

Fig. 1
Fig. 1
Increase in B. pertussis incidence over time. Panel a shows B. pertussis cases in the United States from 1922 through 2012 and in the United Kingdom from 1940 through 2013 (from: [17] and [70]). Shaded regions correspond to the pre-vaccine era, the DTP era, and the DTaP era, respectively. Panels b and c show the incidence of B. pertussis by age group with darker color indicating younger ages in the US and UK, respectively. Infants less than 1 year old are labeled in darkest colors
Fig. 2
Fig. 2
Disruption of B. pertussis cycles by vaccination. Panel a shows the square root of B. pertussis cases in infants less than 1 year old in the United Kingdom from 1982 through 2013 (in black) and the percentage vaccine coverage over the same period (in blue). Vertical dashed line indicates the switch to an aP vaccination schedule. Panel b shows the standard wavelet spectrum of the incidence in panel a; panel c shows the Fourier spectrum of the incidence. As vaccination coverage increases (1985 through about 1991) we see a decrease in the power of cycles of approximately 4 years. We begin to see an increase in this power after the introduction of aP vaccination in 2004, suggesting transmission patterns similar to those observed in the pre-transmission-blocking vaccine era
Fig. 3
Fig. 3
Increase in B. pertussis incidence after switch to aP vaccination. Figure compares the incidence of B. pertussis after the switch to aP vaccination in the US (panel a) and the UK (panel b). Time since the switch is presented on the x-axis. Note the similarities in the timing of spikes in incidence after the switch to aP vaccination
Fig. 4
Fig. 4
Phylodynamic analyses. Figure shows the sampling rate and birth rate derived from the BEAST analysis for the 36 US B. pertussis genomes. Solid white lines with square boxes indicate the posterior median, with the shaded region indicating the 95 % highest posterior density. Darker colors are associated with regions of higher posterior density, with the shape representing the actual posterior density. Despite the birth rate remaining higher after the switch to aP, the sampling rate declines. This pattern would be expected with an increasing rate of asymptomatic transmission
Fig. 5
Fig. 5
Comparing disease-free weeks in pre- and post-vaccination scenarios. Panel a shows the proportion of disease-free weeks (fade-outs) per year for the 50 US states in the pre-vaccine (1920–1945, black points and line) and post-vaccine (2006–2013, blue points and line) eras. Lines indicate best-fit exponential curves. Panel b shows the mean duration of consecutive disease-free weeks in both eras
Fig. 6
Fig. 6
Changes in transmission in pre- and post-vaccination scenarios? Figure shows the proportion of disease-free weeks (fade-outs) for various population sizes from the stochastic formulation of the model. Panel a compares the symptomatic cases in the aP vaccination era with those in the pre-vaccine era; panel b compares the symptomatic to asymptomatic cases in the vaccine era; panel c compares the asymptomatic cases in the post-vaccine era with those in the pre-vaccine era. These results demonstrate no changes in transmission due to vaccination. Parameters: birth rate (μ) = death rate (ν) = 1/75 years −1; recovery rates for symptomatic (γ s) and asymptomatic (γ a) = 14 days −1; probability of symptomatic infection (σ) = 0.25; transmissibility (β) is calculated per value of R 0
Fig. 7
Fig. 7
How does an inefficient vaccine affect situational awareness? Figure shows the percent difference in observed infections (symptomatic) from true infections (symptomatic + asymptomatic) at steady state as aP vaccination rate increases and the probability of symptomatic infection increases. Shaded area indicates a range of reasonable aP vaccination rates. At current aP vaccination coverage levels, the majority of cases are asymptomatic and therefore undetected. See Additional file 1 for model details. Parameters: birth rate (μ) = death rate (ν) = 1/75 years −1; recovery rates for symptomatic (γ s) and asymptomatic (γ a) = 14 days −1; baseline wP vaccination rate = 0.9; transmissibility (β) is calculated such that R 0=18. Note that previously published values of R 0 for pertussis range from 16–20 [71] to closer to 5 in some populations [72]
Fig. 8
Fig. 8
Can an inefficient vaccine lead to increased transmission? Figure demonstrates the fold increase in observed symptomatic and unobserved asymptomatic infections after transitioning from a wP to an aP vaccine. This is calculated by dividing the number of symptomatic or asymptomatic cases with various levels of aP coverage (reported on the x-axis) and 0 % wP coverage by the number of cases with 90 % wP coverage and 0 % aP coverage. This was designed to simulate the switch from wP to aP in the US and UK (going from high wP coverage to coverage with aP). We see an increase in symptomatic cases across a large range of aP vaccination coverage levels. See Additional file 1 for model details. The gray band indicates the empirical 5.4-fold (95 % bootstrap confidence interval: 0.4–13.3) increase in cases in the US comparing 2012 to the years 1985 through 1995. The model recreates the observed increase in cases. Parameters: birth rate (μ) = death rate (ν) = 1/75 years −1; recovery rates for symptomatic (γ s) and asymptomatic (γ a) = 14 days −1; probability of symptomatic infection (σ) = 0.25; baseline wP vaccination rate = 0.9; transmissibility (β) is calculated such that R 0=18
Fig. 9
Fig. 9
Effects of including waning immunity on symptomatic and asymptomatic infections. Figure shows percent increases in symptomatic and asymptomatic cases at equilibrium after the switch to aP vaccination with inclusion of waning immunity. Parameters: birth rate (μ) = death rate (ν) = 1/75 years −1; recovery rates for symptomatic (γ s) and asymptomatic (γ a) = 14 days −1; probability of symptomatic infection (σ) = 0.25; baseline wP vaccination rate = 0.9; transmissibility (β) is calculated such that R 0=18

References

    1. Jackson DW, Rohani P. Perplexities of pertussis: recent global epidemiological trends and their potential causes. Epidemiol Infect. 2013;142:1–13. - PMC - PubMed
    1. CDC Pertussis (Whooping Cough) Surveillance & Reporting. http://www.cdc.gov/pertussis/surv-reporting.html.
    1. Office for National Statistics, UK, Datasets and reference tables. http://www.ons.gov.uk/ons/datasets-and-tables/index.html.
    1. Águas R, Gonçalves G, Gomes MGM. Pertussis: increasing disease as a consequence of reducing transmission. Lancet Infect Dis. 2006;6:112–7. doi: 10.1016/S1473-3099(06)70384-X. - DOI - PubMed
    1. World Health Organization. Progress Towards Global Immunization Goals - 2012. http://www.unicef.org/immunization/files/SlidesGlobalImmunization.pdf.

Publication types

Substances