. 2015 Aug;168(4):1702-16.
doi: 10.1104/pp.15.00307. Epub 2015 Jun 23.

MicroRNA396-Targeted SHORT VEGETATIVE PHASE Is Required to Repress Flowering and Is Related to the Development of Abnormal Flower Symptoms by the Phyllody Symptoms1 Effector

Affiliations

MicroRNA396-Targeted SHORT VEGETATIVE PHASE Is Required to Repress Flowering and Is Related to the Development of Abnormal Flower Symptoms by the Phyllody Symptoms1 Effector

Chiao-Yin Yang et al. Plant Physiol. 2015 Aug.

Abstract

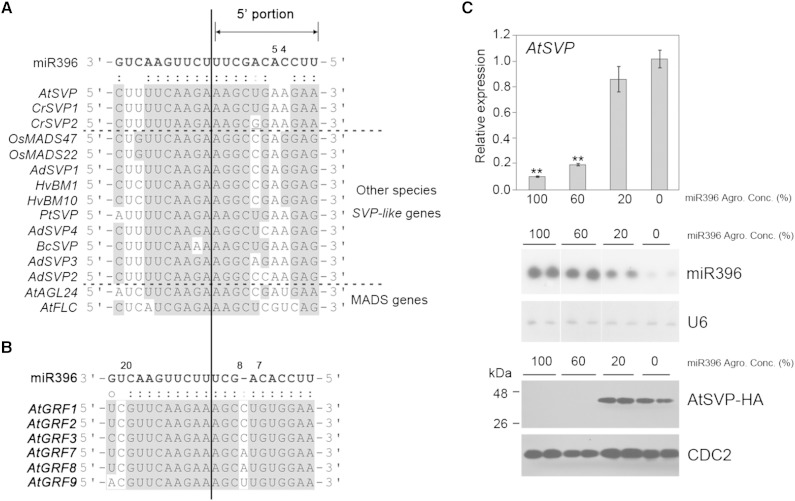
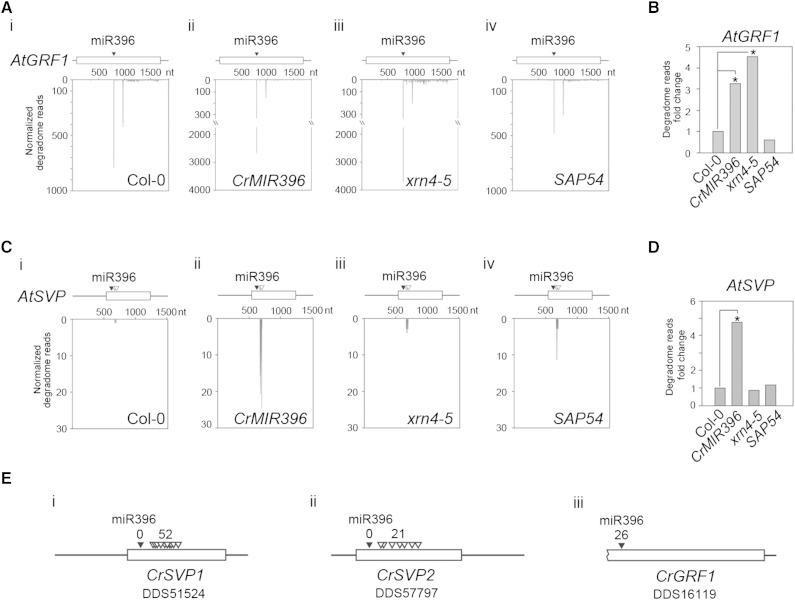
Leafy flowers are the major symptoms of peanut witches' broom (PnWB) phytoplasma infection in Catharanthus roseus. The orthologs of the phyllody symptoms1 (PHYL1) effector of PnWB from other species of phytoplasma can trigger the proteasomal degradation of several MADS box transcription factors, resulting in leafy flower formation. In contrast, the flowering negative regulator gene SHORT VEGETATIVE PHASE (SVP) was up-regulated in PnWB-infected C. roseus plants, but most microRNA (miRNA) genes had repressed expression. Coincidentally, transgenic Arabidopsis (Arabidopsis thaliana) plants expressing the PHYL1 gene of PnWB (PHYL1 plants), which show leafy flower phenotypes, up-regulate SVP of Arabidopsis (AtSVP) but repress a putative regulatory miRNA of AtSVP, miR396. However, the mechanism by which PHYL1 regulates AtSVP and miR396 is unknown, and the evidence of miR396-mediated AtSVP degradation is lacking. Here, we show that miR396 triggers AtSVP messenger RNA (mRNA) decay using genetic approaches, a reporter assay, and high-throughput degradome profiles. Genetic evidence indicates that PHYL1 plants and atmir396a-1 mutants have higher AtSVP accumulation, whereas the transgenic plants overexpressing MIR396 display lower AtSVP expression. The reporter assay indicated that target-site mutation results in decreasing the miR396-mediated repression efficiency. Moreover, degradome profiles revealed that miR396 triggers AtSVP mRNA decay rather than miRNA-mediated cleavage, implying that AtSVP caused miR396-mediated translation inhibition. We hypothesize that PHYL1 directly or indirectly interferes with miR396-mediated AtSVP mRNA decay and synergizes with other effects (e.g. MADS box transcription factor degradation), resulting in abnormal flower formation. We anticipate our findings to be a starting point for studying the posttranscriptional regulation of PHYL1 effectors in symptom development.


Figures

Figure 1.
Figure 1.
The leafy flower phenotypes of PnWB phytoplasma-infected C. roseus plants. A, The healthy flower (HF) and S4 PnWB-infected leafy flower symptoms are presented in the left and right columns, respectively. Bars = 1 cm. B and C, The mRNA (B) and microRNA (miRNA; C) expression of the HF and S4 in C. roseus flowers are represented by heat maps. Red indicates up-regulated expression, and blue indicates down-regulated expression. The values at right indicate the results of the log2 (S4/HF) formula. CrAG, AGAMOUS of C. roseus; CrFYF, FOREVER YOUNG FLOWER of C. roseus; CrPI, PISTILLATA of C. roseus.
Figure 2.
Figure 2.
The phytoplasma effectors trigger the leafy flower phenotype. A, Alignment of orthologous amino acids of PHYL1. OY-W, Onion yellows phytoplasma wild-type line. B, Leafy flower phenotypes of PHYL1 and SAP54 plants. The type I leafy flower is indicated as LF-I, and the type II leafy flower is indicated as LF-II. Bars = 0.5 cm. C, The abnormal flower phenotype of PHYL1 plants. The type I to III phenotypes are indicated as AF-I, AF-II, and AF-III, respectively. Bars = 0.5 cm.
Figure 3.
Figure 3.
Phytoplasma effectors interfere with miRNA expression. A, MiRNA expression in flowers of Col-0, PHYL1, and SAP54 plants as represented by a heat map. Red indicates up-regulated expression, and blue indicates down-regulated expression. The values at right indicate the results of the log2 (Col-0/PHYL1 or Col-0/SAP54) formula. B, MiR396 detection in Col-0, PHYL1, and svp32 plants by northern blot. U6 was used as a loading control. The numbers indicate the relative expression of miR396 compared with Col-0 plants.
Figure 4.
Figure 4.
Characterization of MIR396, CrSVP1, and CrSVP2 in C. roseus. A, Illustration of the hairpin structures of the MIR396 precursors of C. roseus and their paired sequences. The mature miR396 (solid line) and miR396* (dashed line) are indicated on the precursor structure (top). The pairing of the miR396 (black) and miR396* (gray) sequences are indicated at bottom. The numbers indicate the deep-sequence reads of miR396 or miR396*. B, Predicted targets of miR396 in the MADS box domain of SVP genes. The nucleotide sequences of the CrSVP1 (DDS_51524), CrSVP2 (DDS_57797), and AtSVP (AT2G22540) targets were aligned, and the paired regions with miR396 are indicated. In the SVP alignment, dots indicate identical nucleotides, whereas boldface letters indicate the nucleotides that are perfectly paired between SVP and miR396. The translated SVP amino acids are presented below the alignment. C, Analysis of miR396 expression between HF and S4 PnWB-infected leafy flower by small RNA northern blot. The small RNA loading quantity was adjusted to 200 ng using the 2100 Bioanalyzer (Agilent). The numbers below indicate the relative fold change in the expression of miR396 regarding the S4 flowers relative to the HFs. CrU6 small nuclear RNA was used as a loading control. D, Semi-RT-PCR analyses of the CrSVP1 and CrSVP2 expression levels in an HF, S4 flower, and healthy leaf (HL). UBIQUITIN (UBQ) of C. roseus was used as an internal control. The numbers indicate the fold change in CrSVP1 and CrSVP2 expression in the S4 flower and HL samples relative to the HF. E, Phylogenetic tree of SVP proteins. The genes sharing greater than 80% amino acid similarity are classified and shaded in gray. AtSOC1 is referred to as an outgroup. The numbers indicate the percentage of 1,000 bootstrap replicates at the appropriate nodes. The scale bar indicates a 0.1 divergence of amino acid substitutions per site.
Figure 5.
Figure 5.
SVP contains variation pairing of the 5′ portion of miR396 with its target genes. A, Highly conserved miR396 target sites on the SVP genes of various species. The alignment of the miR396 target sites in SVP genes of various species is shown. The GenBank accession numbers of the SVP genes are as follows: AtSVP (NM127820), AtAGL24 (NM118587), AdSVP1 (JF838212), AdSVP2 (JF838213), AdSVP3 (JF838214), AdSVP4 (JF838215), HvBM1 (AJ249142), HvBM10 (EF043040), OsMADS22 (AB107957), OsMADS47 (AY345221), BcSVP (DQ922945), and PtSVP (FJ373210). AtAGL24 and AtFLC (AT5G10140) were chosen as representative MADS genes for target-site comparison. The SVP nucleotides that pair with the miR396 sequences are indicated in gray. B, The miR396 target-site alignment for GRFs (AtGRF1, AT2G22840; AtGRF2, AT4G37740; AtGRF3, AT2G36400; AtGRF7, AT5G53660; AtGRF8, At4G24150; and AtGRF9, AT2G45480). Gray shading indicates the nucleotides of AtGRFs paired with the miR396 sequences. C, In vivo analysis of miR396-mediated AtSVP-HEMAGGLUTININ (HA) efficiency by transient expression. The relative expression levels of AtSVP were normalized to that of NbACTIN via real-time RT-PCR. Error bars represent se (n = 6). The relative expression levels were significantly different from those in Col-0 plants for each RNA sample, based on Student’s t test: **, P < 0.01. The various percentages of miR396 were determined by a small RNA northern blot. U6 small nuclear RNAs were used as loading controls. The various percentages of miR396 are indicated below the real-time RT-PCR and northern-blot data. The AtSVP-HA protein level was detected by western blotting with a 1:10,000 dilution of HA antibody. CELL DIVISION CONTROL2 (CDC2) was used as a protein loading control.
Figure 6.
Figure 6.
The reporter assay for miR396-mediated targeted down-regulation. A, Schematic of miR396 and its target-site pairing on the YFP gene. All of the constructs were constructed on a binary vector under the control of a 35S promoter. A YFP-only construct (i) was used as a negative control. The SVP129-YFP construct (ii) represents 129 nucleotides of the 5′ end of the SVP gene containing the miR396 target site fused with the YFP gene. The SVP129m-YFP construct (iii) represents 129 nucleotides of the 5′ end of the SVP gene containing a mutated miR396 target site fused with the YFP gene. The GRF1129-YFP construct (iv) represents 129 nucleotides of the 5′ end of the GRF1 gene containing the miR396 target site fused with the YFP gene. B, The YFP reporter assay was analyzed using confocal microscopy. Bar = 100 µm. C, Relative average YFP expression levels (log2) of the reporter assay as determined by confocal microscopy (n = 3). Relative YFP expression levels were significantly different from that of the negative control construct without miR396 present in each sample, based on Student’s t test: **, P < 0.01; and *, P < 0.05. MiR396 was detected by northern blot for each sample (two replicates). U6 small nuclear RNA was used as a loading control.
Figure 7.
Figure 7.
Characterization of miR396 and SVPs in Arabidopsis plants. A, Diagram of the atmir396a-1 mutant (SALK064047). The black arrows indicate the gene regions for AT2G10605, AtMIR396a (AT2G10606), and AT2G10608 and their translation directions. The T-DNA insertion site is located at the promoter region (450 bp upstream) of AtMIR396a. The left border (LB) and right border (RB) are indicated at the two borders of the T-DNA. The primers LP, RP, and LBb1.3 were used for genotyping via PCR. Bar = 150 bp. B, Analysis of miR396 by small RNA northern blot in Col-0, svp32 mutant, atmir396a-1 mutant, two independent CrMIR396 lines (lines 8 and 27), and AtMIR396a-overexpressing plants. U6 small RNA was used as a loading control. The numbers below indicate fold changes in miR396 expression relative to the Col-0 plant. C, CrSVP1, CrSVP2, atmir396a-1, and svp32 (SALK072930C) mutant plants exhibited normal flower phenotypes. CrMIR396 and AtMIR396a plants exhibited abnormal flower phenotypes. Plants with AdSVP2 or AtSVP overexpression exhibited leafy or abnormal flower phenotypes, respectively. Bars = 0.1 cm. D, Evaluation of the flowering time of various Arabidopsis mutant or transgenic plants. Leaf number represents flowering time. Error bars represent se (n = 20). E, MiR396-mediated AtSVP and AtGRF1 regulation. AtSVP and AtGRF1 were detected by real-time RT-PCR. Relative expression levels were normalized to the level of AtUBQ. Error bars represent se (n = 3). Relative expression levels were significantly different from those of the Col-0 plants in each RNA sample, based on Student’s t test: *, P < 0.05; and **, P < 0.01.
Figure 8.
Figure 8.
PHYL1 alters the expression of miR396 and its targets. A, AtSVP and AtGRF1 expression levels in Col-0, PHYL1, and svp32 plants were detected by real-time RT-PCR. Error bars represent se (n = 9). Relative expression levels were normalized to the level of AtUBQ. Relative expression levels were significantly different from those of the Col-0 plants in each RNA sample, based on Student’s t test: *, P < 0.05; and **, P < 0.01. B, Detection of SVP gene expression in floral bud tissue by in situ hybridization. The buds of Col-0 (i) and PHYL1 (ii) plants were sectioned and hybridized with an antisense probe for SVP detection. The sense probe for AtSVP was used as a negative control (iii and iv). The black arrows indicate the AtSVP signal at the sepal, and the red arrows indicate the AtSVP signals at the basal part of the petal. an, Anther; pe, petal; se, sepal; st, stigma. Bar = 50 µm.
Figure 9.
Figure 9.
Degradome analysis of C. roseus and Arabidopsis. A and C, Degradome patterns of AtGRF1 (A) and AtSVP (C) in flower buds of Col-0, CrMIR396, xrn4-5 mutant, and PHYL1 plants. nt, Nucleotides. B and D, Fold changes in the degradome of AtGRF1 (B) and AtSVP (D) in flower buds of Col-0, CrMIR396, xrn4-5 mutant, and PHYL1 plants. The fold changes were significantly different from those of the Col-0 plants in each RNA sample based on Student’s t test: *, P < 0.01. E, Degradome patterns of CrSVP1, CrSVP2, and CrGRF1 in flowers of C. roseus. The black arrowheads indicate the miR396 target site. The white arrowheads indicate the nonspecific RNA degradation position.
Figure 10.
Figure 10.
Model for PHYL1-regulated miR396-mediated SVP expression in the flowering pathway resulting in the abnormal flower phenotype.

Similar articles

Cited by

References

    1. Bao M, Bian H, Zha Y, Li F, Sun Y, Bai B, Chen Z, Wang J, Zhu M, Han N (2014) miR396a-mediated basic helix-loop-helix transcription factor bHLH74 repression acts as a regulator for root growth in Arabidopsis seedlings. Plant Cell Physiol 55: 1343–1353 - PubMed
    1. Bazzini AA, Lee MT, Giraldez AJ (2012) Ribosome profiling shows that miR-430 reduces translation before causing mRNA decay in zebrafish. Science 336: 233–237 - PMC - PubMed
    1. Bowman JL, Alvarez J, Weigel D, Meyerowitz EM, Smyth DR (1993) Control of flower development in Arabidopsis thaliana by APETALA1 and interacting genes. Development 119: 721–743
    1. Chang TC (2012) Identification of conserved microRNAs and their targets in PnWB phytoplasma induced leafy flower of Catharanthus roseus. PhD thesis. National Taiwan University, Taipei, Taiwan
    1. Chorostecki U, Crosa VA, Lodeyro AF, Bologna NG, Martin AP, Carrillo N, Schommer C, Palatnik JF (2012) Identification of new microRNA-regulated genes by conserved targeting in plant species. Nucleic Acids Res 40: 8893–8904 - PMC - PubMed

Publication types

MeSH terms

LinkOut - more resources