

Review
doi: 10.1161/JAHA.114.001140.
What are white matter hyperintensities made of? Relevance to vascular cognitive impairment
Affiliations
- PMID: 26104658
- PMCID: PMC4599520
- DOI: 10.1161/JAHA.114.001140
Item in Clipboard
Review
What are white matter hyperintensities made of? Relevance to vascular cognitive impairment
J Am Heart Assoc.
.
Erratum in
-
What are White Matter Hyperintensities Made of?J Am Heart Assoc. 2016 Jan 13;5(1):e002006. doi: 10.1161/JAHA.115.002006. J Am Heart Assoc. 2016. PMID: 30526205 Free PMC article. No abstract available.
No abstract available
Keywords: ageing; cognition; dementia; leukoaraiosis; magnetic resonance imaging; small vessel disease; stroke; white matter hyperintensities.
Figures
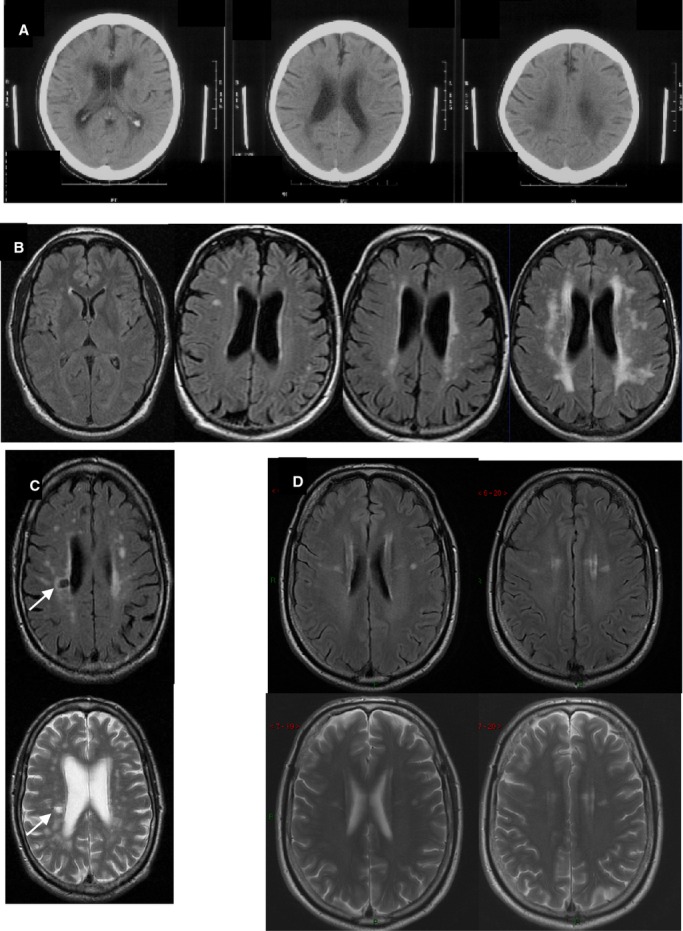
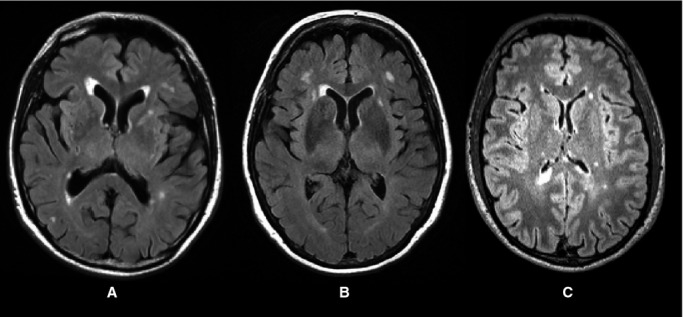
Examples of WMH on (A) CT, (B) MR FLAIR, (C and D) MR FLAIR and T2-weighted imaging. A, Three adjacent CT images from 1 patient with severe WMH. B, Four different subjects showing, L to R, normal to severe WMH. C, FLAIR and T2-w, same subject, show WMH and a lacune (arrow). D, top FLAIR, bottom T2-w images showing that when subtle, WMH are more easily seen on FLAIR. CT indicates computed tomography; FLAIR, fluid attenuated inversion recovery; MR, magnetic resonance; WMH, white matter hyperintensities.
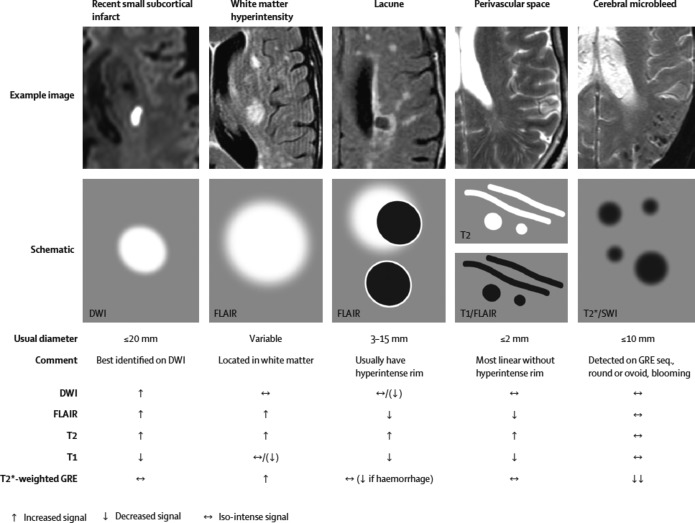
STRIVE examples of different features of small vessel disease, including white matter hyperintensities. Reproduced with permission from Wardlaw et al. DWI indicates diffusion-weighted imaging; FLAIR, fluid attenuated inversion recovery; GRE, gradient recalled echo; STRIVE, standards for reporting vascular changes on neuroimaging; SWI, susceptibility-weighted imaging.
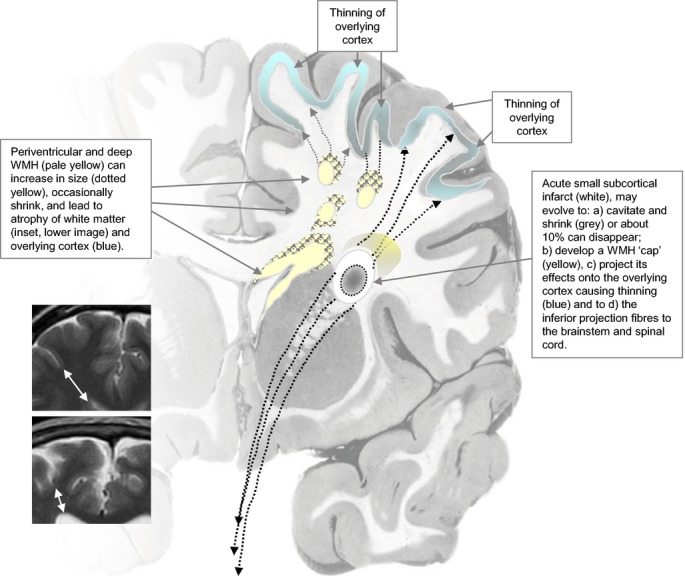
Diagram of dynamic mechanisms by which WMH and SVD lead to brain damage. See separate file. SVD indicates small vessel disease; WMH, white matter hyperintensities.
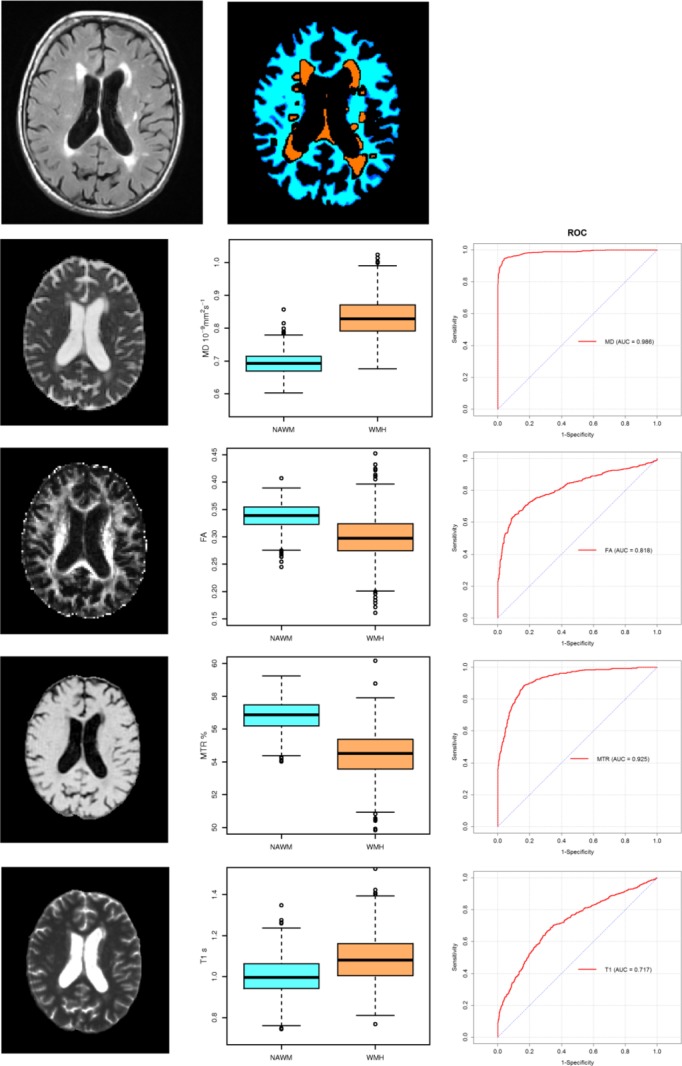
Images for FA, MD, T1, and MTR and corresponding values in normal-appearing white matter and WMH. And corresponding ROC curves for each parameter’s ability to differentiate normal white matter from WMH. MD shows a near perfect ROC curve. Top 2 images show the original FLAIR image and the tissue segmentation into normal white matter and WMH. FA indicates fractional anisotropy; FLAIR, fluid attenuated inversion recovery; MD, mean diffusivity; MTR, magnetisation transfer ratio; NAWM, normal-appearing white matter; ROC, receiver operator characteristic; WMH, white matter hyperintensities.
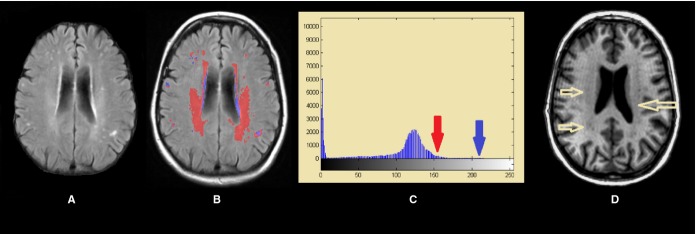
FLAIR image through the lateral ventricles showing severe (ie, intense) WMH and less-intense white matter damage (A), represented in blue and red, respectively in (B) and which correspond with the intensities arrowed in the histogram (C). Less-intense damage can be also observed in the T1-weighted modality as the yellow arrows show (D). FLAIR indicates fluid-attenuation inversion recovery; WMH, white matter hyperintensities.
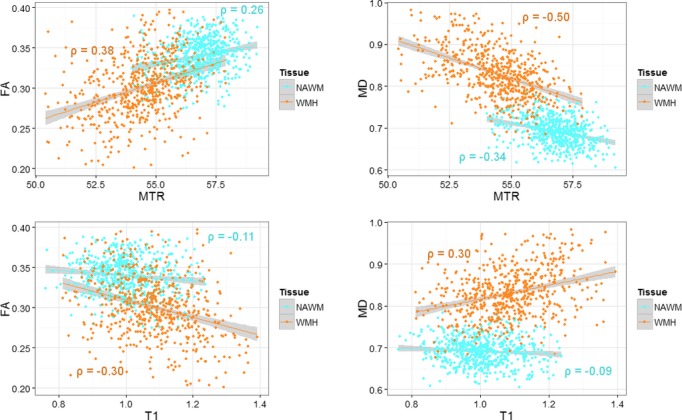
Correlations between FA, MTR, MD and T1 in NAWM and WMH. In general, the T1 and FA, MD and MTR show stronger correlations in WMH than in NAWM. FA indicates fractional anisotropy; MD, mean diffusivity; MTR, magnetization transfer ratio; NAWM, normal-appearing white matter; WMH, white matter hyperintensities.
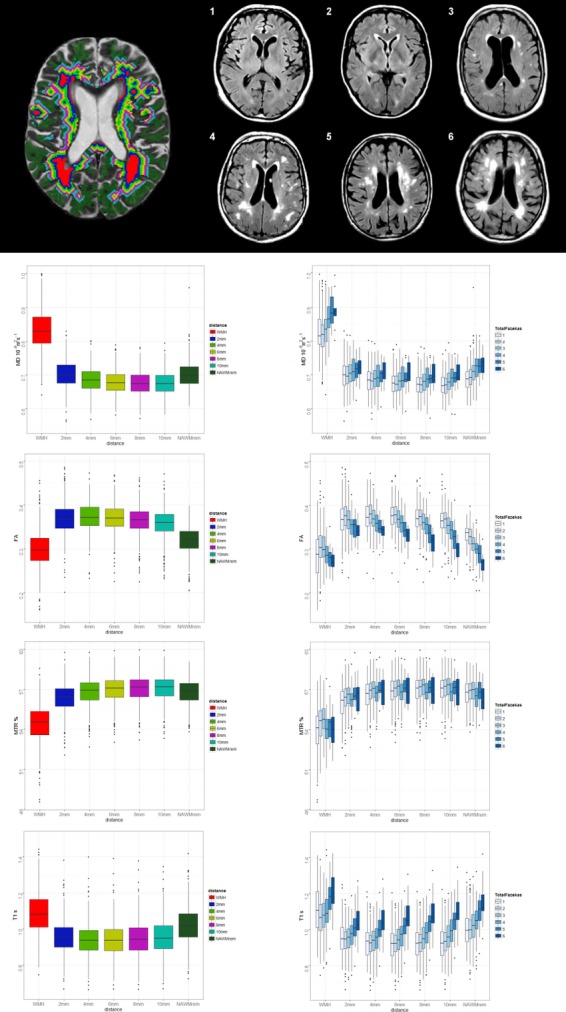
Effect on MD, FA, MTR, and T1 of increasing burden of WMH, in the WMH and at 2 mm distance increments from the WMH edge into the NAWM (2 mm-NAWMrem). Top left, illustrates WMH (red) and contours (different color bands), right, 1 to 6, WMH Fazekas scores. Lower left graphs show change in the 4 MR parameters from WMH and at increasing distance into the NAWM; lower right graphs show the parameter changes at increasing distance into NAWM split by total WMH burden (Fazekas score). Adapted from Muñoz-Maniega et al. FA indicates fractional anisotropy; MD, mean diffusivity; MTR, magnetisation transfer ratio; NAWM, normal-appearing white matter; WMH, white matter hyperintensities.
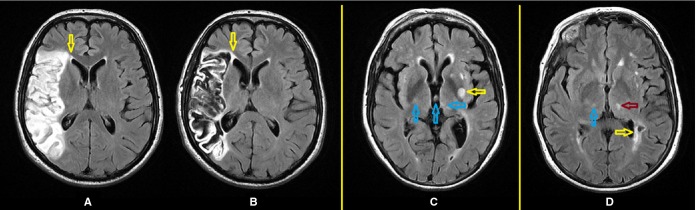
Some factors which confound the delineation of WMH. FLAIR axial images from a patient 4 days after a stroke (A) and a year later (B): while the boundary of the periventricular WMH can be well perceived on the baseline scan, it coalesces with the large infarct after a year (yellow arrow) making it impossible to quantitatively determine accurately the increase in the stroke lesion separated from the increase in the WMH. Different patient (C) has a recent small subcortical stroke lesion arrowed in yellow, and artifacts arrowed in blue; (D) a lacune (yellow arrow) confluent with the periventricular WMH, real thalamic hyperintensity arrowed in magenta and thalamic artifact arrowed in blue create difficulties for measuring the WMH. FLAIR indicates fluid attenuation inversion recovery; WMH, white matter hyperintensities.
Three different patients, but with similar amounts of WMH, scanned with slightly different slice thicknesses and at 1.5 or 3 T, illustrate the resulting differences in signal of WMH and normal tissues and hence the need for changes in tissue and WMH volume measurement methods. Slice thickness 1 mm2 (A), 0.479 mm2 (B), and 1 mm2 (C) and MR scanner field strength—1.5 T (A and B) and 3 T (C) affect image appearance. Alterations in imaging parameters influence the image appearance and hence the performance of any software used to measure the WMH as all software ultimately rely on differences in signal characteristics between the tissue and lesions of interest. MR indicates magnetic resonance; WMH, white matter hyperintensities.
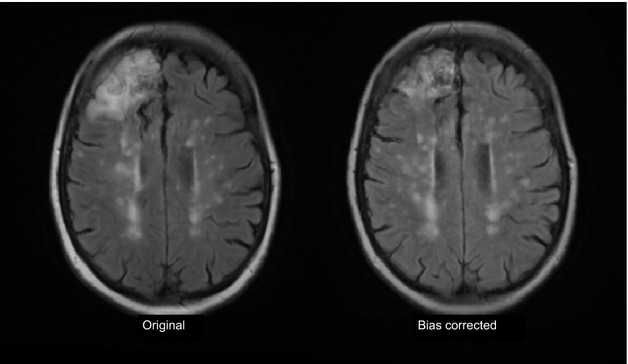
Effect of incautious use of bias field correction on cortical infarct and WMH. The left image shows the original MR FLAIR image with a right frontal cortical infarct (arrow) and numerous WMH. Following bias field correction (left) the frontal infarct appears much smaller, some of the WMH have become more (eg, posterior areas) and some now appear split into smaller components (mid centrum semiovale) as the bias field smoothing software tries to “even out” the distribution of signal intensities across the image. FLAIR indicates fluid attenuation inversion recovery; MR, magnetic resonance; WMH, white matter hyperintensities.
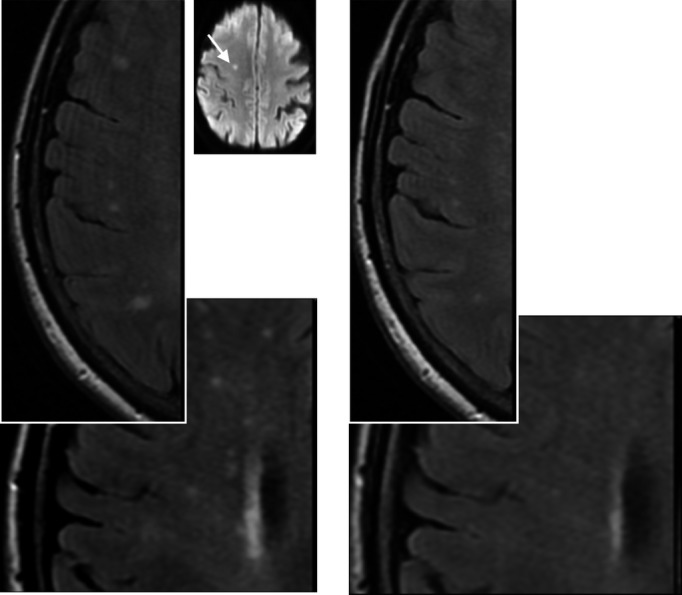
Example of disappearing white matter hyperintensities. Left, scan at presentation with small subcortical infarct. Right, scan 1 year later. Inset image is diffusion image from original presentation showing small subcortical infarct that precipitated medical consultation. The images were obtained on the same scanner, using the same sequence with careful quality assurance maintained throughout. Note the lesions have become smaller and less white at 1 year compared with presentation.
References
-
- Lozano R, Naghavi M, Foreman K, Lim S, Shibuya K, Aboyans V, Abraham J, Adair T, Aggarwal R, Ahn SY, Alvarado M, Anderson HR, Anderson LM, Andrews KG, Atkinson C, Baddour LM, Barker-Collo S, Bartels DH, Bell ML, Benjamin EJ, Bennett D, Bhalla K, Bikbov B, Bin AA, Birbeck G, Blyth F, Bolliger I, Boufous S, Bucello C, Burch M, Burney P, Carapetis J, Chen H, Chou D, Chugh SS, Coffeng LE, Colan SD, Colquhoun S, Colson KE, Condon J, Connor MD, Cooper LT, Corriere M, Cortinovis M, de Vaccaro KC, Couser W, Cowie BC, Criqui MH, Cross M, Dabhadkar KC, Dahodwala N, De Leo D, Degenhardt L, Delossantos A, Denenberg J, Des Jarlais DC, Dharmaratne SD, Dorsey ER, Driscoll T, Duber H, Ebel B, Erwin PJ, Espindola P, Ezzati M, Feigin V, Flaxman AD, Forouzanfar MH, Fowkes FG, Franklin R, Fransen M, Freeman MK, Gabriel SE, Gakidou E, Gaspari F, Gillum RF, Gonzalez-Medina D, Halasa YA, Haring D, Harrison JE, Havmoeller R, Hay RJ, Hoen B, Hotez PJ, Hoy D, Jacobsen KH, James SL, Jasrasaria R, Jayaraman S, Johns N, Karthikeyan G, Kassebaum N, Keren A, Khoo JP, Knowlton LM, Kobusingye O, Koranteng A, Krishnamurthi R, Lipnick M, Lipshultz SE, Ohno SL, Mabweijano J, MacIntyre MF, Mallinger L, March L, Marks GB, Marks R, Matsumori A, Matzopoulos R, Mayosi BM, McAnulty JH, McDermott MM, McGrath J, Mensah GA, Merriman TR, Michaud C, Miller M, Miller TR, Mock C, Mocumbi AO, Mokdad AA, Moran A, Mulholland K, Nair MN, Naldi L, Narayan KM, Nasseri K, Norman P, O’Donnell M, Omer SB, Ortblad K, Osborne R, Ozgediz D, Pahari B, Pandian JD, Rivero AP, Padilla RP, Perez-Ruiz F, Perico N, Phillips D, Pierce K, Pope CA, III, Porrini E, Pourmalek F, Raju M, Ranganathan D, Rehm JT, Rein DB, Remuzzi G, Rivara FP, Roberts T, De Leon FR, Rosenfeld LC, Rushton L, Sacco RL, Salomon JA, Sampson U, Sanman E, Schwebel DC, Segui-Gomez M, Shepard DS, Singh D, Singleton J, Sliwa K, Smith E, Steer A, Taylor JA, Thomas B, Tleyjeh IM, Towbin JA, Truelsen T, Undurraga EA, Venketasubramanian N, Vijayakumar L, Vos T, Wagner GR, Wang M, Wang W, Watt K, Weinstock MA, Weintraub R, Wilkinson JD, Woolf AD, Wulf S, Yeh PH, Yip P, Zabetian A, Zheng ZJ, Lopez AD, Murray CJ. Global and regional mortality from 235 causes of death for 20 age groups in 1990 and 2010: a systematic analysis for the Global Burden of Disease Study 2010. Lancet. 2013;380:2095–2128. - PMC - PubMed
-
- Gorelick PB, Scuteri A, Black SE, DeCarli C, Greenberg SM, Iadecola C, Launer LJ, Laurent S, Lopez OL, Nyenhuis D, Petersen RC, Schneider JA, Tzourio C, Arnett DK, Bennett DA, Chui HC, Higashida RT, Lindquist R, Nilsson PM, Roman GC, Sellke FW, Seshadri S. Vascular contributions to cognitive impairment and dementia: a statement for healthcare professionals from the American Heart Association/American Stroke Association. Stroke. 2011;42:2672–2713. - PMC - PubMed
-
- Smallwood A, Oulhaj A, Joachim C, Christie S, Sloan C, Smith AD, Esiri M. Cerebral subcortical small vessel disease and its relation to cognition in elderly subjects: a pathological study in the Oxford Project to Investigate Memory and Ageing (OPTIMA) cohort. Neuropathol Appl Neurobiol. 2012;38:337–343. - PubMed
-
- Hachinski VC, Potter P, Merskey H. Leuko-araiosis. Arch Neurol. 1987;44:21–23. - PubMed
Publication types
MeSH terms
LinkOut - more resources
Full Text Sources
Other Literature Sources
