. 2015 Sep 18;48(12):3427-32.
doi: 10.1016/j.jbiomech.2015.05.030. Epub 2015 Jun 12.

Expedited patient-specific assessment of contact stress exposure in the ankle joint following definitive articular fracture reduction

Affiliations

Expedited patient-specific assessment of contact stress exposure in the ankle joint following definitive articular fracture reduction

Andrew M Kern et al. J Biomech. .

Abstract

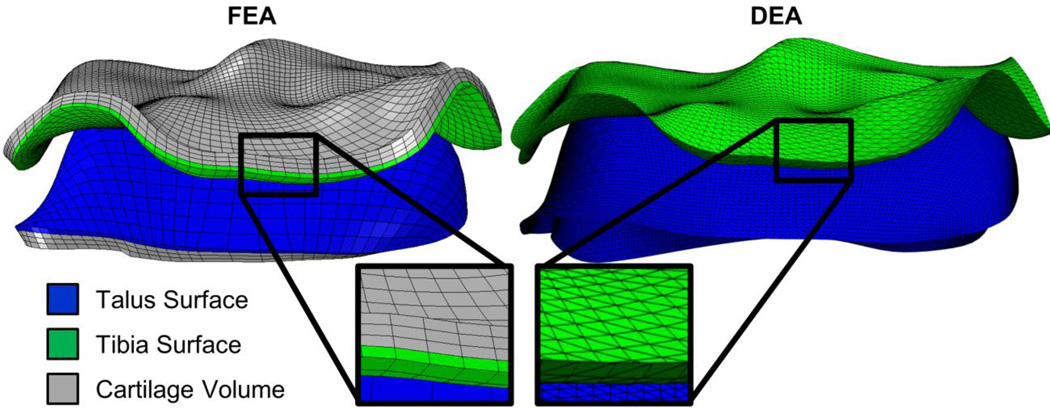
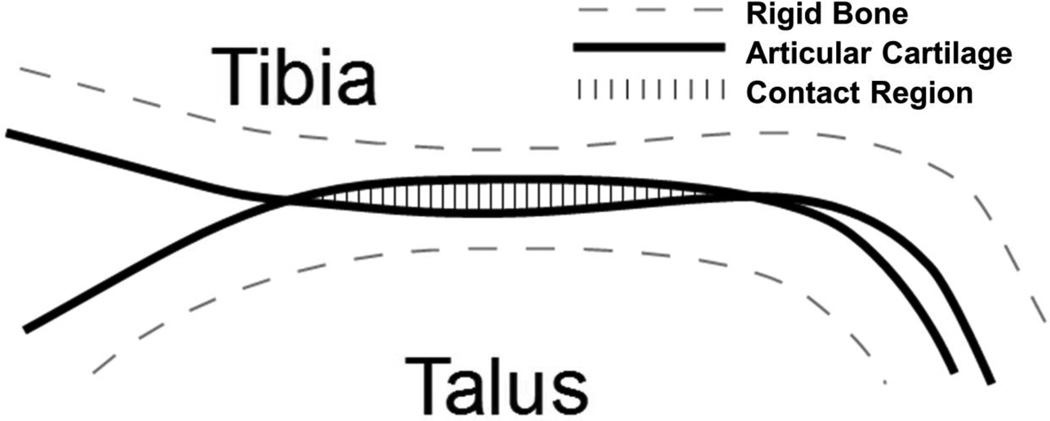
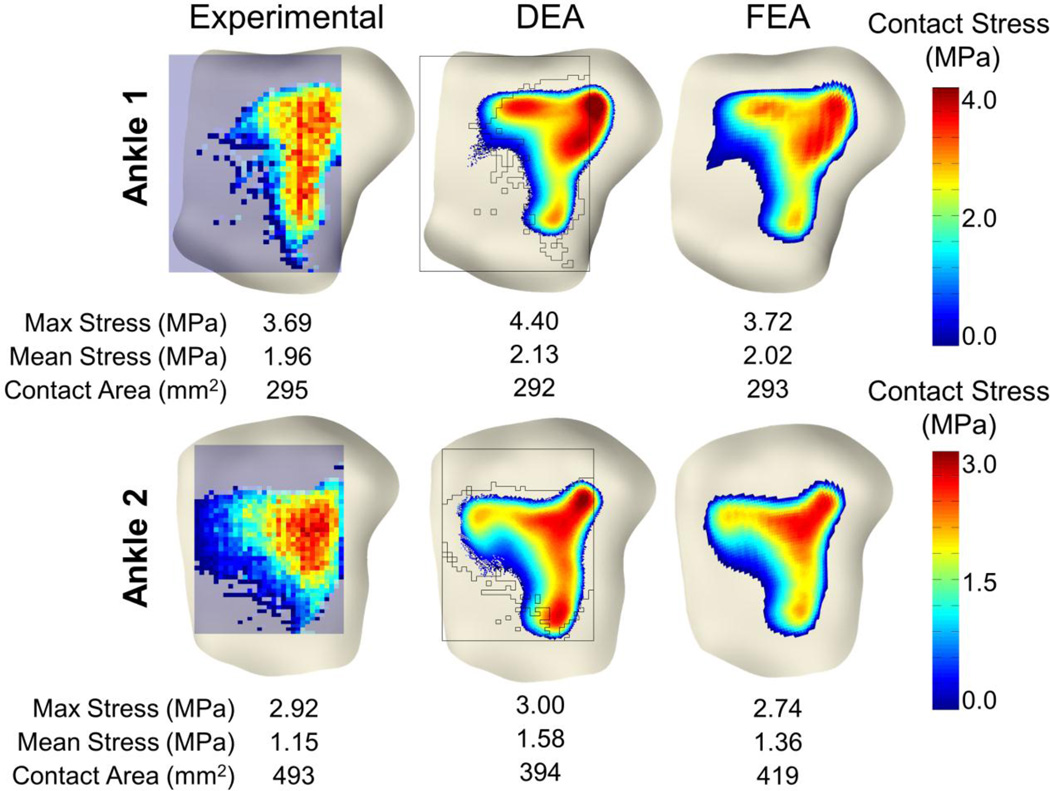
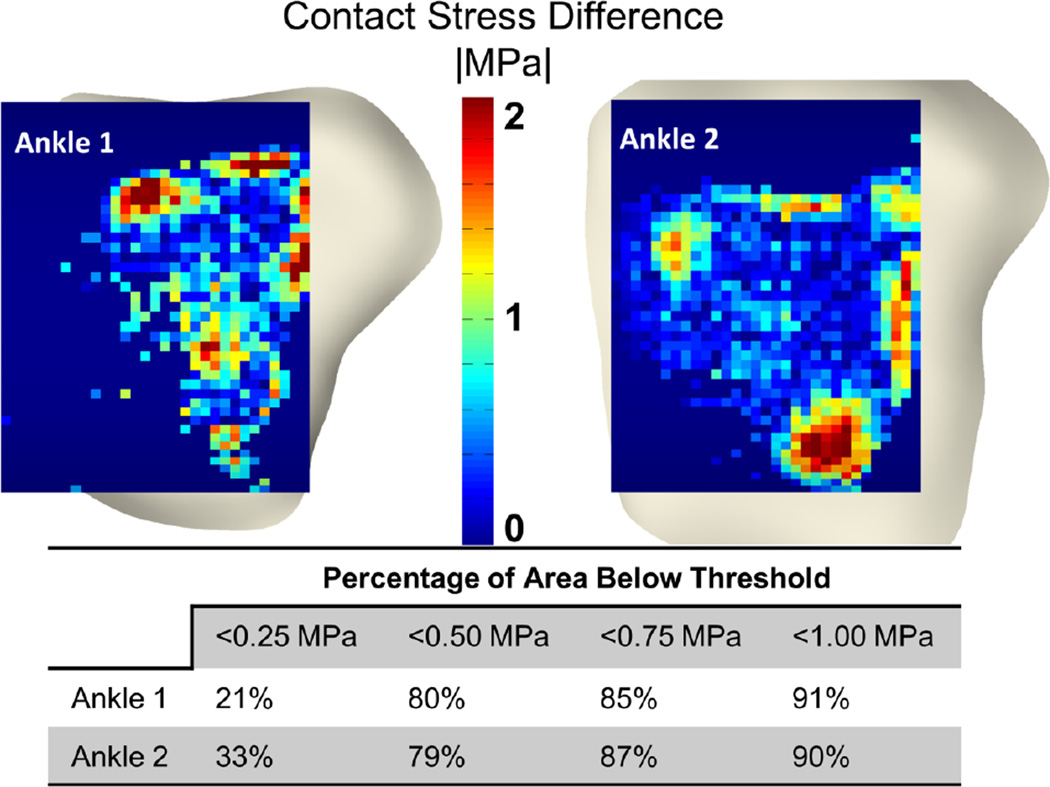
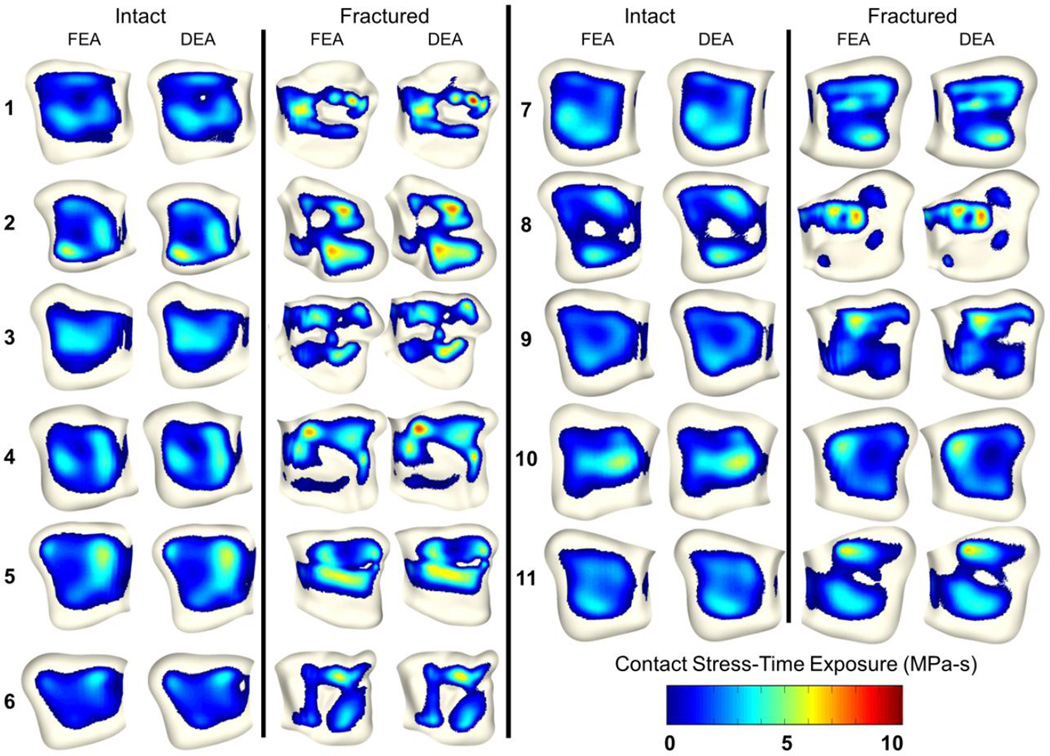
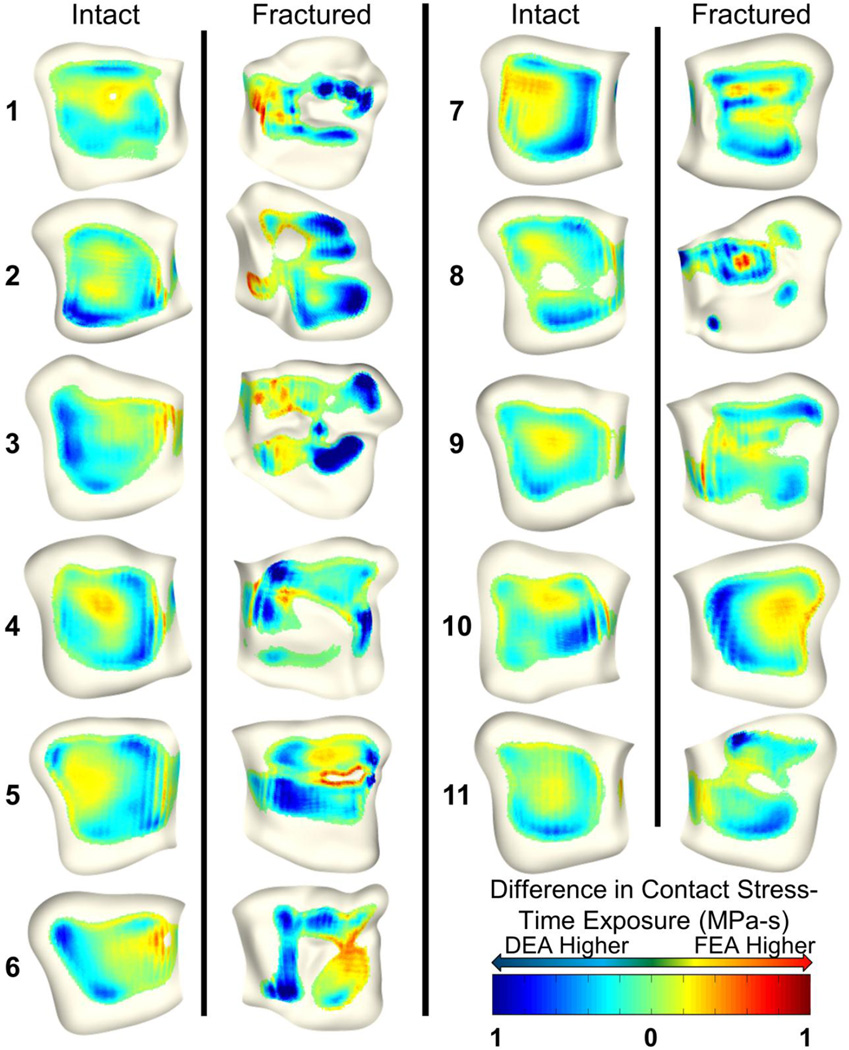
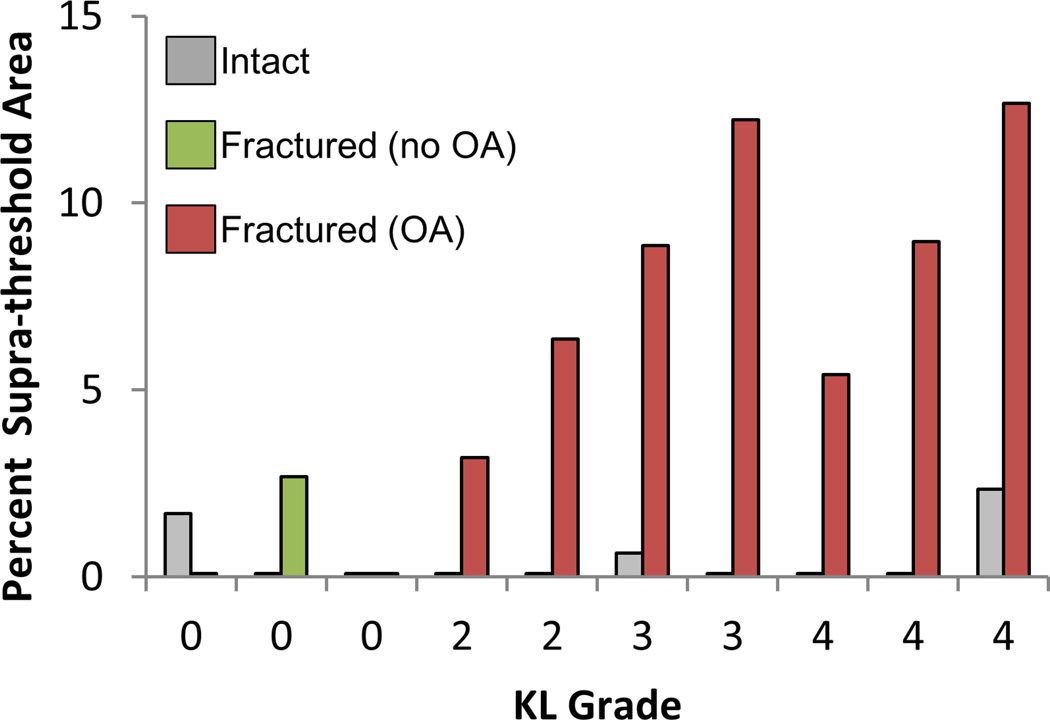
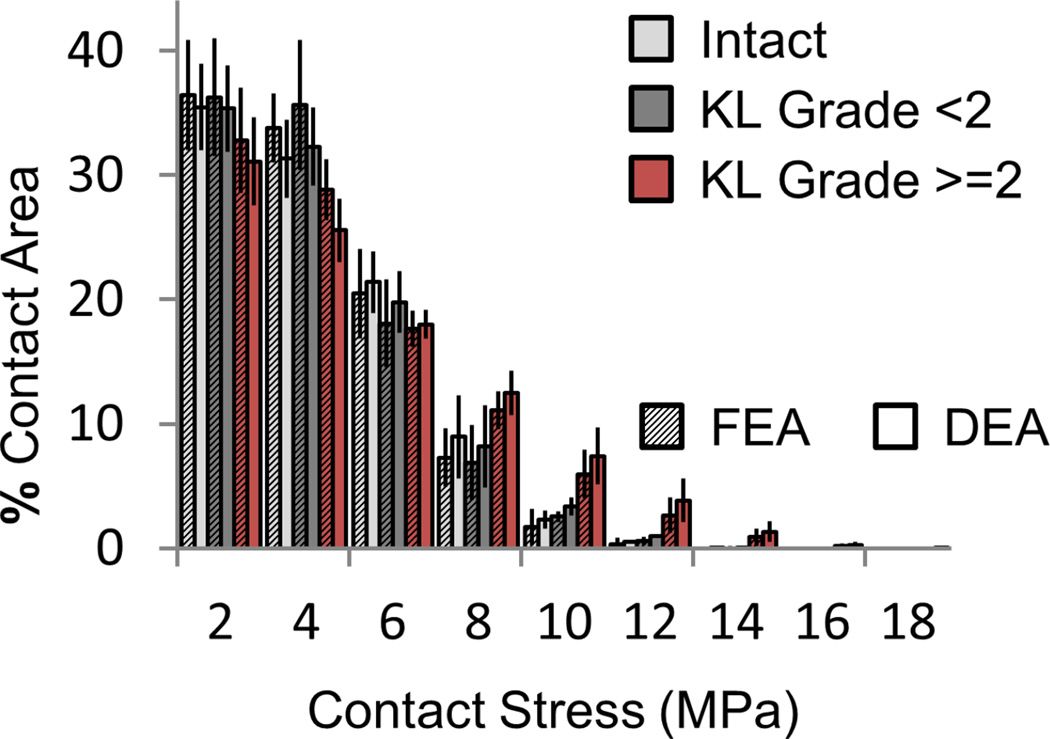
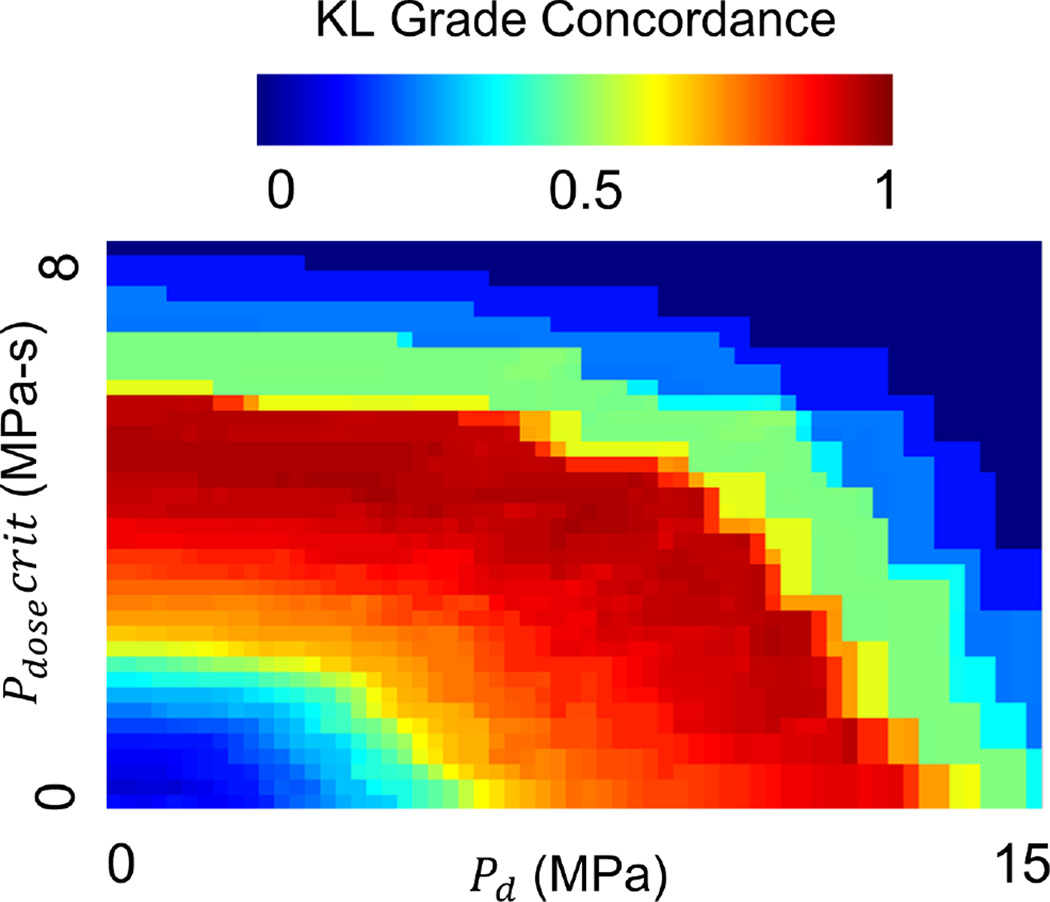
Acute injury severity, altered joint kinematics, and joint incongruity are three important mechanical factors linked to post-traumatic osteoarthritis (PTOA). Finite element analysis (FEA) was previously used to assess the influence of increased contact stress due to joint incongruity on PTOA development. While promising agreement with PTOA development was seen, the inherent complexities of contact FEA limited the numbers of subjects that could be analyzed. Discrete element analysis (DEA) is a simplified methodology for contact stress computation, which idealizes contact surfaces as a bed of independent linear springs. In this study, DEA was explored as an expedited alternative to FEA contact stress exposure computation. DEA was compared to FEA using results from a previously completed validation study of two cadaveric human ankles, as well as a previous study of post-operative contact stress exposure in 11 patients with tibial plafond fracture. DEA-computed maximum contact stresses were within 19% of those experimentally measured, with 90% of the contact area having computed contact stress values within 1MPa of those measured. In the 11 fractured ankles, maximum contact stress and contact area differences between DEA and FEA were 0.85 ± 0.64 MPa and 22.5 ± 11.5mm(2). As a predictive measure for PTOA development, both DEA and FEA had 100% concordance with presence of OA (KL grade ≥ 2) and >95% concordance with KL grade at 2 years. These results support DEA as a reasonable alternative to FEA for computing contact stress exposures following surgical reduction of a tibial plafond fracture.

Keywords: Ankle; Contact stress; Discrete element; Finite element; Posttraumatic osteoarthritis.


Conflict of interest statement

Conflict of Interest Statement: None

Figures

Figure 1
Figure 1
FEA (left) and DEA (right) models are shown side-by-side. The articular cartilage surfaces from the tibia (green) and talus (blue) are extracted from the FEA mesh and bisected to form triangular shell elements. This allows direct spatial comparison between DEA and FEA results
Figure 2
Figure 2
Illustration of DEA implementation. Subchondral bone is treated as rigid and articular cartilage is treated as isotropic – linear elastic and frictionless. Springs representing the cartilage are generated from the apparent penetration of the two articular cartilage surfaces.
Figure 3
Figure 3
Comparison of physical Tekscan (left) (Anderson et al., 2007) with DEA (center) and FEA (right) contact stress results. Contact stress distributions and magnitudes compared well with both the FEA and physical testing results. The black silhouette overlaid on the DEA results represents the Tekscan sensor and the boundary of the measured contact region.
Figure 4
Figure 4
Spatial comparison between DEA and physical Tekscan measurements (top). Contact stress between the Tekscan and the DEA were similar with 90% of the contact area having < 1 MPa difference.
Figure 5
Figure 5
Comparison of FEA (Li et al., 2008) and DEA contact stress-time exposure (MPa-s), computed over a normative 13-step gait cycle. Contact stress distributions and magnitudes compare well with FEA.
Figure 6
Figure 6
Spatial distributions of contact stress-time exposure (MPa-s) differences between FEA and DEA. Blue colors indicate higher DEA contact stress and red colors indicate higher FEA contact stress. While overall discrepancies appear low, FEA tends to compute higher contact stress around the borders of contact and DEA to compute higher stress around focal stress concentrations.
Figure 7
Figure 7
Contact stress overexposure (% of total contact area exceeding Pd, 4.0 MPa also exceeding Pdosecrit, 5.5 MPa-s) computed on DEA contact stress values. The particular values for these parameters were selected to maximize the gap between intact cases (grey), fractured cases with no radiographic OA (green) and fractured cases with OA (red). This represents a one set of a variety of different parameters that may by viable for comparing contact stress overexposure to OA.
Figure 8
Figure 8
Contact stress (MPa) area engagement histogram for FEA (textured) and DEA (solid). Both intact (light gray) and fractured (dark gray) cases that did not show radiographic OA (KL score < 2 at two year follow-up) have lower areas of engagement at high contact stress levels than fractured cases that did develop radiographic OA (red).
Figure 9
Figure 9
Ad-hoc computation of Pd and Pdosecrit obtained by sampling the entire feasible space of parameters. Parameters are shown vs. KL grade concordance to demonstrate that there are a number of possible exposure metrics. Further experimentation with additional cases is required to find which parameters are most predictive.

References

    1. Abraham CL, Maas SA, Weiss JA, Ellis BJ, Peters CL, Anderson AE. A new discrete element analysis method for predicting hip joint contact stresses. J Biomech. 2013;46:1121–1127. - PMC - PubMed
    1. An KN, Himeno S, Tsumura H, Kawai T, Chao EY. Pressure distribution on articular surfaces: application to joint stability evaluation. J Biomech. 1990;23:1013–1020. - PubMed
    1. Anderson DD, Chubinskaya S, Guilak F, Martin JA, Oegema TR, Olson SA, Buckwalter JA. Post-traumatic osteoarthritis: improved understanding and opportunities for early intervention. J Orthop Res. 2011;29:802–809. - PMC - PubMed
    1. Anderson DD, Goldsworthy JK, Li W, Rudert MJ, Tochigi Y, Brown TD. Physical validation of a patient-specific contact finite element model of the ankle. J Biomech. 2007;40:1662–1669. - PMC - PubMed
    1. Anderson DD, Van Hofwegen C, Marsh JL, Brown TD. Is elevated contact stress predictive of post-traumatic osteoarthritis for imprecisely reduced tibial plafond fractures? J Orthop Res. 2010;29:33–39. - PMC - PubMed

Publication types