. 2015 Jun 24:6:7500.
doi: 10.1038/ncomms8500.

A genome-wide association study identifies multiple loci for variation in human ear morphology

Affiliations

A genome-wide association study identifies multiple loci for variation in human ear morphology

Kaustubh Adhikari et al. Nat Commun. .

Abstract

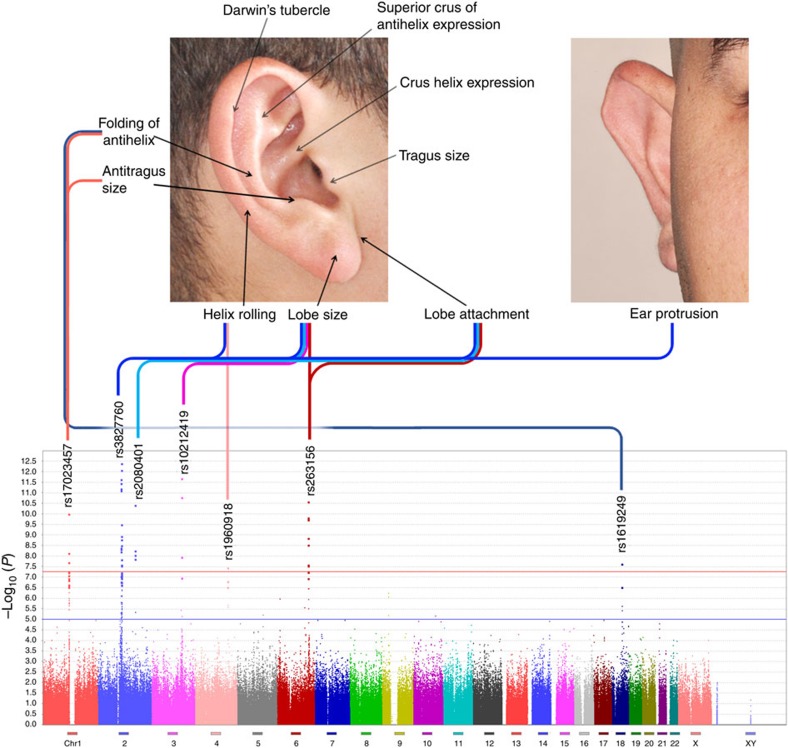
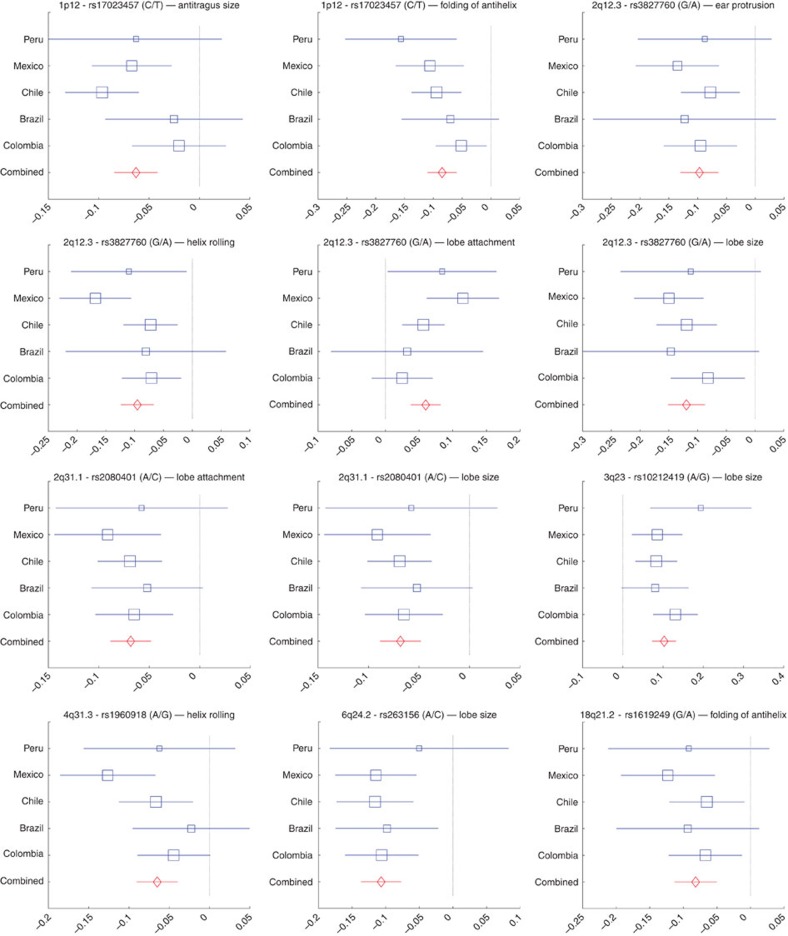
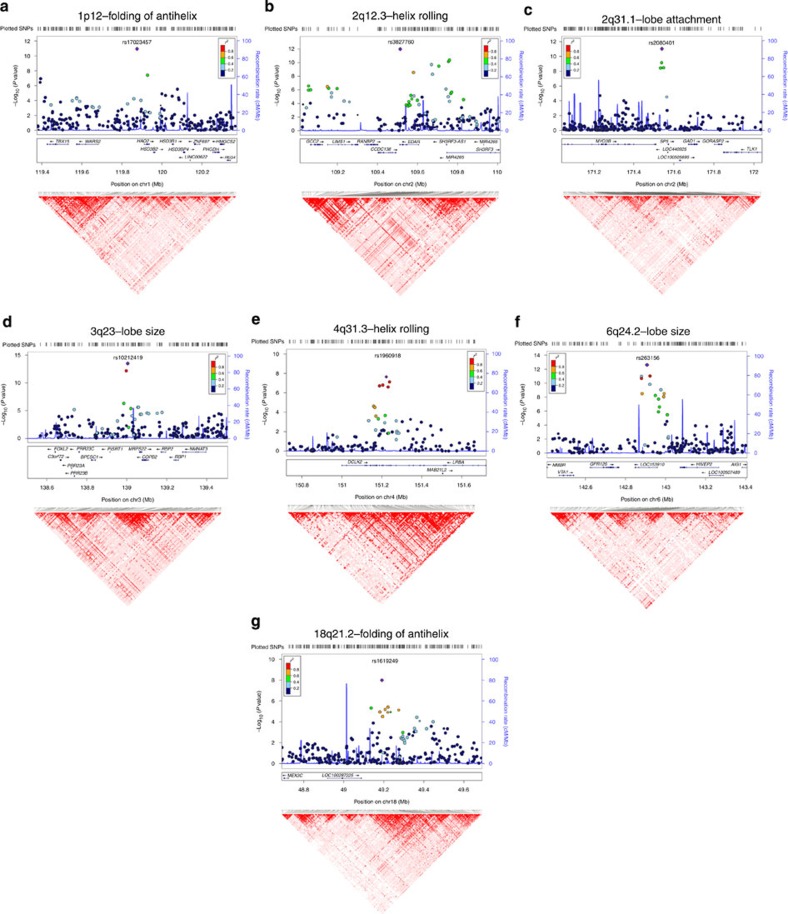
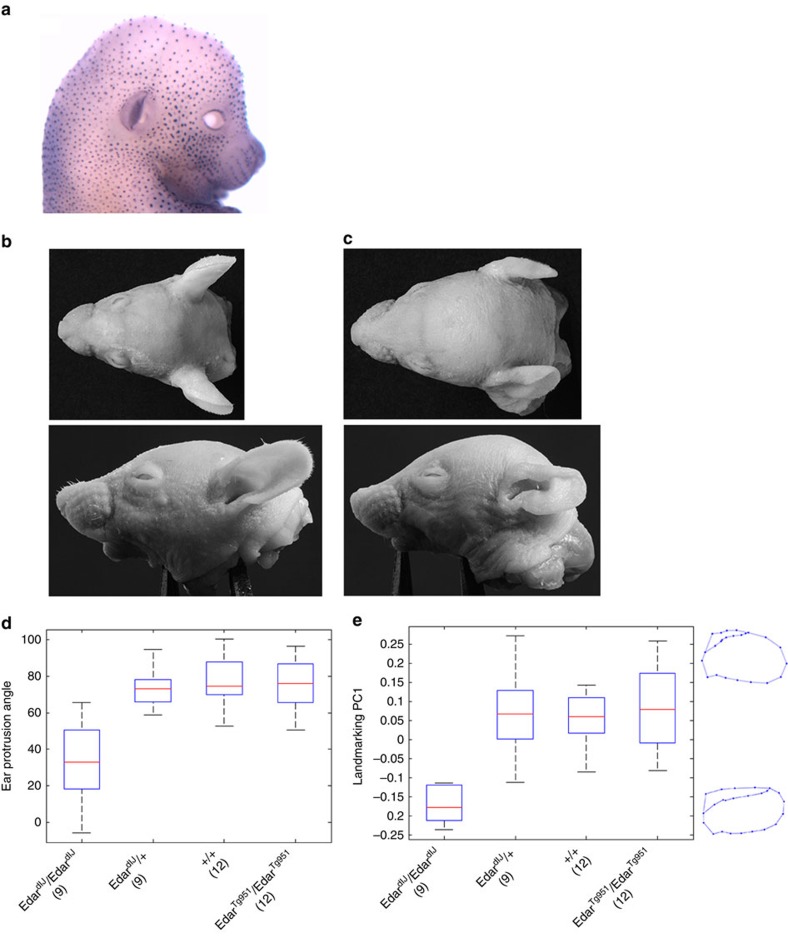
Here we report a genome-wide association study for non-pathological pinna morphology in over 5,000 Latin Americans. We find genome-wide significant association at seven genomic regions affecting: lobe size and attachment, folding of antihelix, helix rolling, ear protrusion and antitragus size (linear regression P values 2 × 10(-8) to 3 × 10(-14)). Four traits are associated with a functional variant in the Ectodysplasin A receptor (EDAR) gene, a key regulator of embryonic skin appendage development. We confirm expression of Edar in the developing mouse ear and that Edar-deficient mice have an abnormally shaped pinna. Two traits are associated with SNPs in a region overlapping the T-Box Protein 15 (TBX15) gene, a major determinant of mouse skeletal development. Strongest association in this region is observed for SNP rs17023457 located in an evolutionarily conserved binding site for the transcription factor Cartilage paired-class homeoprotein 1 (CART1), and we confirm that rs17023457 alters in vitro binding of CART1.


Figures

Figure 1
Figure 1. Genome-wide associations of pinna traits.
Variation in 10 pinna traits was evaluated in 5,062 individuals. The photographs at the top indicate the location of the traits examined. At the bottom is shown a composite Manhattan plot for the seven traits showing genome-wide significant association with at least one genome region. The rs numbers for the most significantly associated (index) SNP in each region are provided (Table 1). Each of the seven regions on the Manhattan plot is connected with the associated trait on the photos via a line of different colour (composite panels in this and subsequent figures were made using Photoshop49).
Figure 2
Figure 2. Meta-analysis of significant genome-wide associations.
Effect sizes (in each country sample and in a combined meta-analysis) for the index SNPs and their associated traits (Table 1). Regression coefficients (x axis) estimated in each country are shown as blue boxes (box size indicating sample size). Red diamonds indicate effect sizes estimated in the meta-analysis. Horizontal bars indicate s.e. Results for all the SNPs and traits shown in Table 1 are provided in Supplementary Fig. 6A. The two alleles at each SNP are shown in brackets with effect size referring to the allele in the numerator.
Figure 3
Figure 3. LocusZoom and linkage disequilibrium plots of significantly associated genetic regions.
Plots of the seven genomic regions showing genome-wide significant association to pinna traits (Table 1). For regions showing association with several pinna traits, we present here only results for the trait with strongest association (plots for the other associated traits are presented in Supplementary Fig. 7). Association results from a multivariate linear regression model (on a −log10 P scale; left y axis) are shown for SNPs ∼500 kb on either side of the index SNP (that is, the SNP with the smallest P value, purple diamond; Table 1) with the marker (dot) colour indicating the strength of LD (r2) between the index SNP and that SNP in the 1000 Genomes AMR data set. Local recombination rate in the AMR data is shown as a continuous blue line (scale on the right y axis). Genes in each region, their intron–exon structure, direction of transcription and genomic coordinates (in Mb, using the NCBI human genome sequence, Build 37, as reference) are shown at the bottom. Plots were produced with LocusZoom. Below each region we also show an LD heatmap (using D′, ranging from red indicating D′=1 to white indicating D′=0) produced using Haploview. Note that the location of SNPs on the LD heatmap can be shifted relative to the regional display on top of it.
Figure 4
Figure 4. Effect of Edar genetic variation on mouse pinna shape.
(a) Whole-mount in situ hybridization detecting Edar expression in the developing mouse embryo at 15 days' gestation. (be) Impact of Edar genotype on mutant mouse ear shape. (b,c) Photographs of wild-type (b) and homozygous EdardlJ (c) mutant mice from top and side views (respectively, on the upper and lower panels). (d,e) Boxplots, respectively, of ear protrusion angle and of landmark coordinate PC1 (y axis) for different mouse genotypes (x axis) (Supplementary Note 1; Supplementary Fig. 10 shows additional analyses for ear protrusion). Boxplot whiskers extend to data points within 1.5 times the interquartile range on both sides. In d,e numbers in parenthesis below genotypic categories refer to the number of mice examined for each. On the right of e are shown average PC1 wireframes for EdardlJ homozygous mice (bottom) or for mice with other genotypes (top).

References

    1. Gleeson M. J. & Clarke R. C. Scott-Brown's Otorhinolaryngology: Head and Neck Surgery CRC Press (2008).
    1. Cox T. C., Camci E. D., Vora S., Luquetti D. V. & Turner E. E. The genetics of auricular development and malformation: new findings in model systems driving future directions for microtia research. Eur. J. Med. Genet. 57, 394–401 (2014). - PMC - PubMed
    1. Azaria R., Adler N., Silfen R., Regev D. & Hauben D. J. Morphometry of the adult human earlobe: a study of 547 subjects and clinical application. Plast. Reconstr. Surg. 111, 2398–2402 discussion 2403–2404 (2003). - PubMed
    1. Sforza C. et al. Age- and sex-related changes in the normal human ear. Forensic Sci. Int. 187, 110 e1–110 e7 (2009). - PubMed
    1. Alexander K. S., Stott D. J., Sivakumar B. & Kang N. A morphometric study of the human ear. J. Plast. Reconstr. Aesthet. Surg. 64, 41–47 (2011). - PubMed

Publication types

MeSH terms