. 2015 Jun 9:9:220.
doi: 10.3389/fncel.2015.00220. eCollection 2015.

Network-timing-dependent plasticity

Affiliations

Network-timing-dependent plasticity

Vincent Delattre et al. Front Cell Neurosci. .

Abstract

Bursts of activity in networks of neurons are thought to convey salient information and drive synaptic plasticity. Here we report that network bursts also exert a profound effect on Spike-Timing-Dependent Plasticity (STDP). In acute slices of juvenile rat somatosensory cortex we paired a network burst, which alone induced long-term depression (LTD), with STDP-induced long-term potentiation (LTP) and LTD. We observed that STDP-induced LTP was either unaffected, blocked or flipped into LTD by the network burst, and that STDP-induced LTD was either saturated or flipped into LTP, depending on the relative timing of the network burst with respect to spike coincidences of the STDP event. We hypothesized that network bursts flip STDP-induced LTP to LTD by depleting resources needed for LTP and therefore developed a resource-dependent STDP learning rule. In a model neural network under the influence of the proposed resource-dependent STDP rule, we found that excitatory synaptic coupling was homeostatically regulated to produce power law distributed burst amplitudes reflecting self-organized criticality, a state that ensures optimal information coding.

Keywords: STDP; acute brain slices; neural networks simulations; patch-clamp; self-organized criticality; somatosensory cortex; synaptic plasticity.


Figures
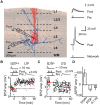
FIGURE 1
FIGURE 1
Induction of long-term potentiation (LTP) and long-term depression (LTD) by pairing an EPSP with a short burst of action potentials (APs), or by network bursting. (A) Cortical slice mounted on a 3D-multi-electrode array (MEA), with a reconstruction of a layer 5 pyramidal neuron (blue axons, red dendrites) overlaid (left). A whole-cell patch of the pyramidal neuron (post) receiving an EPSP (pre) evoked by extracellular electrical stimulation (upper-right). The post-synaptic responses due to network bursts evoked by MEA stimulation in the region of layer 5 are overlaid for 30 repetitions (lower-right). (B) A typical recording for the STDP+ paradigm (STDP+; black circles). EPSP amplitude was measured every 10 s (baseline and final amplitude indicated by the red line). (C) A typical recording for the STDP- paradigm (STDP-; black circles). (D) Mean change in EPSP amplitude for STDP+ (ΔEPSP amp. = 103 ± 33%, n = 11), STDP- (ΔEPSP amp. = -44 ± 10%, n = 6) and 0.1 Hz network bursting (ΔEPSP amp. = -25 ± 20%; n = 9).
FIGURE 2
FIGURE 2
Network-timing-dependent modulation of Spike-Timing-Dependent Plasticity (STDP). (A) Pairing of STDP+ with MEA evoked network bursts at various relative timings with respect to the presynaptic STDP+ input. (B) EPSP amplitude changes due to burst-STDP+ pairings when the burst precedes (ΔT = -20 ms; blue circles) or follows (ΔT = 50 ms; gray circles) the STDP+ event (black circles). (C) Summary of changes in EPSP amplitude for the various STDP+ protocols. Dotted lines and gray shaded areas show the mean ± SEM EPSP amplitude change induced by STDP+ and STDP-. Depending on its relative timing, the burst either flipped LTP to LTD (burst preceding; ΔT = -20 ms), blocked LTP (burst following; ΔT = 50 ms, ± 5 s), or had no effect on the STDP pairing (simultaneous burst; ΔT = 0 ms). (D) Pairing of STDP- with network bursts at various timings. (E) EPSP amplitude changes due to burst-STDP- pairings when the burst precedes (ΔT = -50 ms; gray circles) or follows (ΔT = 20 ms; red circles) the STDP- event (black circles). (F) Summary of changes in EPSP amplitude for the various STDP- protocols. Dotted lines and gray shaded areas show the mean ± SEM EPSP amplitude change induced by STDP+ and STDP-. STDP- induced LTD is unaffected unless the burst shortly follows the STDP- event (ΔT = 20 ms).
FIGURE 3
FIGURE 3
Burst-spike-substitution (BSS) protocols do not explain the flip from LTP to LTD and LTD to LTP, and inhibitory circuits do not contribute to the flip from LTP to LTD. (A) EPSP amplitude changes for BSS protocols of burst-STDP+ pairings, with simultaneous AP and EPSP at ΔT = -20 ms (red), ΔT = 0 ms (black) and ΔT = 50 ms (gray). All timings yielded LTP. (B) EPSP amplitude changes for BSS protocols of burst-STDP- pairings, with simultaneous AP and EPSP at ΔT = 20 ms (red), ΔT = 0 ms (black) and ΔT = -50 ms (gray). All timings yielded LTD. (C) Average normalized EPSP baseline waveforms for control cells, and cells with intracellular picrotoxin (PTX) reveal the effect of PTX on the evoked response by the stimulation with the extracellular pipette. (D) EPSP amplitude change for the STDP+ event (black) with the network burst at ΔT = -20 ms (blue), and with the network burst at ΔT = -20 ms with PTX (red).
FIGURE 4
FIGURE 4
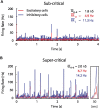
A modest increase in excitatory coupling leads to spontaneous network bursting. Firing rate of recurrent randomly connected network of 1000 integrate-and-fire (IF) neurons with 20% inhibitory cells in an active state (see Materials and Methods); formula image is the mean excitatory coupling, formula imagee and formula imagei are the mean firing rate of excitatory (red) and inhibitory (blue) cells in the network, respectively. The simulated network changes its state from sub-critical (A), to super-critical (spontaneous periodic bursting, B) after a 10% increase of mean synaptic weight for excitatory–excitatory connections. (Inset) Example of a typical network burst is shown to the right.
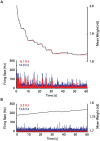
FIGURE 5
FIGURE 5
A STDP model with activity-dependent resource consumption counter-balances runaway potentiation. (A) With a standard STDP rule, the firing rate and mean synaptic weight of a network initialized in a sub-critical state drift toward non-physiological values in a supra-critical state; ω0 is the initial mean excitatory–excitatory synaptic strength. (B) The resource-dependent STDP rule drives networks initialized in a super-critical state toward a critical state.
FIGURE 6
FIGURE 6
Excitatory coupling is rising due to on-going synaptic activity. (A) The mean synaptic weight (black), as in the bottom panel in Figure 5B, but with an enlarged scale. Red dotted horizontal lines have been drawn to indicate the progressive increase of the mean synaptic weight between network bursts. (B) The firing rate and mean synaptic weight of a network with the resource-dependent STDP rule when the network is initialized in a sub-critical state. The mean synaptic weight is continuously rising, and ultimately will reach the threshold for network bursting.
FIGURE 7
FIGURE 7
Self-organized criticality emerges from resource-dependent STDP. (A) Cumulative probability distribution of network burst magnitudes (Clauset et al., 2009). In networks without STDP, varying the mean synaptic weight of excitatory–excitatory connections (ω = formula image) results in different activity regimes: sub-critical with rare aperiodic network bursts (light gray, ω = 1.2 nS), weakly supra-critical with periodic network bursts at rates around 1–10 Hz (dark gray, ω = 2 nS) or strongly supra-critical with periodic network bursts at high rates (black, ω = 3 nS). A standard STDP rule drives the network to a strongly super-critical regime (red), whereas for resource-dependent STDP the resulting burst amplitude statistics follow a power-law (blue). Dashed lines show power-law fits to respective datasets (dot-dashed, ω = 1.2 nS; dashed, ω = 2 nS; cyan-dashed, resource-STDP). (B) The branching parameter (σ) is shown for all networks in (a). In networks without STDP, σ does not evolve (gray traces, ω = 1.2, 2, and 3 nS). With a standard STDP rule, σ increases as the network becomes super-critical (red), whereas with the resource-dependent STDP rule a transition from supra-critical to (sub-) critical occurs rapidly and σ further converges toward a value around 1 (blue).

References

    1. Bak P., Tang C., Wiesenfeld K. (1988). Self-organized criticality. Phys. Rev. Lett. 38 364–374. 10.1103/physreva.38.364 - DOI - PubMed
    1. Bear M. F., Cooper L. N., Ebner F. F. (1987). A physiological basis for a theory of synapse modification. Science 237 42–48. 10.1126/science.3037696 - DOI - PubMed
    1. Beggs J. M., Plenz D. (2003). Neuronal avalanches in neocortical circuits. J. Neurosci. Off. 23 11167–11177. - PMC - PubMed
    1. Bi G. Q., Poo M. M. (1998). Synaptic modifications in cultured hippocampal neurons: dependence on spike timing, synaptic strength, and postsynaptic cell type. J. Neurosci. Off. 18 10464–10472. - PMC - PubMed
    1. Bienenstock E. L., Cooper L. N., Munro P. W. (1982). Theory for the development of neuron selectivity: orientation specificity and binocular interaction in visual cortex. J. Neurosci. 2 32–48. - PMC - PubMed

LinkOut - more resources