. 2015 Jun 8:6:297.
doi: 10.3389/fimmu.2015.00297. eCollection 2015.

In vivo TCR Signaling in CD4(+) T Cells Imprints a Cell-Intrinsic, Transient Low-Motility Pattern Independent of Chemokine Receptor Expression Levels, or Microtubular Network, Integrin, and Protein Kinase C Activity

Affiliations

In vivo TCR Signaling in CD4(+) T Cells Imprints a Cell-Intrinsic, Transient Low-Motility Pattern Independent of Chemokine Receptor Expression Levels, or Microtubular Network, Integrin, and Protein Kinase C Activity

Markus Ackerknecht et al. Front Immunol. .

Abstract

Intravital imaging has revealed that T cells change their migratory behavior during physiological activation inside lymphoid tissue. Yet, it remains less well investigated how the intrinsic migratory capacity of activated T cells is regulated by chemokine receptor levels or other regulatory elements. Here, we used an adjuvant-driven inflammation model to examine how motility patterns corresponded with CCR7, CXCR4, and CXCR5 expression levels on ovalbumin-specific DO11.10 CD4(+) T cells in draining lymph nodes. We found that while CCR7 and CXCR4 surface levels remained essentially unaltered during the first 48-72 h after activation of CD4(+) T cells, their in vitro chemokinetic and directed migratory capacity to the respective ligands, CCL19, CCL21, and CXCL12, was substantially reduced during this time window. Activated T cells recovered from this temporary decrease in motility on day 6 post immunization, coinciding with increased migration to the CXCR5 ligand CXCL13. The transiently impaired CD4(+) T cell motility pattern correlated with increased LFA-1 expression and augmented phosphorylation of the microtubule regulator Stathmin on day 3 post immunization, yet neither microtubule destabilization nor integrin blocking could reverse TCR-imprinted unresponsiveness. Furthermore, protein kinase C (PKC) inhibition did not restore chemotactic activity, ruling out PKC-mediated receptor desensitization as mechanism for reduced migration in activated T cells. Thus, we identify a cell-intrinsic, chemokine receptor level-uncoupled decrease in motility in CD4(+) T cells shortly after activation, coinciding with clonal expansion. The transiently reduced ability to react to chemokinetic and chemotactic stimuli may contribute to the sequestering of activated CD4(+) T cells in reactive peripheral lymph nodes, allowing for integration of costimulatory signals required for full activation.

Keywords: CCR7; CD4+ T cell migration; PKC; T cell activation; lymph node; stathmin.


Figures

Figure 1
Figure 1
Kinetic of DO11.10 CD4+ T cell expansion and activation after OVA/CFA immunization. (A) Outline of experiment. DO11.10 CD4+ T cells were adoptively transferred 1 day before s.c. OVA/CFA immunization. Draining PLNs were analyzed by flow cytometry and chemotaxis. (B) Total pooled PLN lymphocyte numbers during OVA/CFA immunization. (C) Total CD4+ T cell numbers in pooled PLNs during OVA/CFA immunization. (D) Total KJ1–26+ CD4+ T cell numbers in pooled PLNs during OVA/CFA immunization. (E) Representative flow cytometry plots of adoptively transferred CFSE-labeled KJ1–26 and KJ1–26+ cells on day 0 (top panel; R1) and on day 3 post OVA peptide/CFA (middle panel) or OVA/CFA (bottom panel) immunization (R2 and R3, respectively). (F) Flow cytometry analysis of activation markers of KJ1–26 and KJ1–26+ cells in gates R2 and R3 as shown in (E) after priming with peptide. Similar results were obtained with OVA immunization. Numbers indicate percentages in gated populations. Data in (B–D) are pooled from 6 independent experiments combining 4–13 mice/time point and are shown as box and whiskers graphs as described in the section “Materials and Methods.” Flow cytometry plots in (E,F) are representative of two independent experiments. Statistical analysis was performed using ANOVA test against “Day 0” values followed by Dunnett’s multiple comparison test. **p < 0.01; ***p < 0.001.
Figure 2
Figure 2
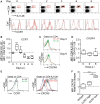
Chemokine receptor regulation on DO11.10 CD4+ T cells after OVA/CFA immunization. (A) Top panel. Representative flow cytometry plots showing expansion and contraction of adoptively transferred KJ1–26+ DO11.10 CD4+ T cells in OVA/CFA-draining PLNs. Bottom panel. Corresponding flow cytometry plots of CCR7 expression on endogenous CD4+ (black) and DO11.10 CD4+ T cells (red). Dashed lines show secondary mAb only. (B) Ratio of CCR7 MFI on KJ1–26+ CD4+ versus endogenous CD4+ T cells after OVA/CFA immunization. (C) Flow cytometry plots of CXCR4 expression on KJ1–26+ CD4+ and endogenous CD4+ T cells after OVA/CFA immunization. The isotype control is shown in gray. (D) Ratio of CXCR4 MFI on KJ1–26+ CD4+ versus endogenous CD4+ T cells after OVA/CFA immunization. (E) Left panel. Gating strategy for CCR7low and CCR7high CD4+ KJ1–26+ T cells on day 5 post OVA/CFA immunization. CCR7 levels on endogenous CD4+ KJ1–26 T cells are depicted in green. Right panel. CXCR5 expression levels on CCR7low (black) and CCR7high (red) CD4+ KJ1–26+ T cells. The isotype control is shown in blue. (F) Ratio of CXCR5 MFI on CCR7low and CCR7high KJ1–26+ CD4+ T cells on days 5/6 after OVA/CFA immunization, normalized to isotype control. Data are pooled from 2–5 independent experiments combining 4–10 mice/time point. Data in (B,D,F) were analyzed using ANOVA and Dunnett’s (B,D) or Tukey’s (F) multiple comparison test and are shown as box and whiskers graphs. **p < 0.01; ***p < 0.001.
Figure 3
Figure 3
In vitro migration of endogenous and DO11.10 CD4+ T cells during OVA/CFA immunization. (A) In vitro chemokinesis of endogenous CD4+ T cells (white bars) and KJ1–26+ DO11.10 CD4+ T cells (black bars) in the absence of chemokine after OVA/CFA immunization. (B) Chemotaxis to 100 nM CCL19. (C) Chemotaxis to 50 nM CCL21. (D) Chemotaxis to 100 nM CCL21. (E) Chemotaxis to 100 nM CXCL12. (F) Chemotaxis to 250 nM CXCL13. Chemokinetic migration (A) was subtracted in (B–F) to focus on chemokine-induced motility. Bars represent mean ± SD of % input and were pooled from three to four independent experiments combining three to eight mice per time point. Statistical analysis was performed separately for endogenous CD4+ T cells and KJ1–26+ DO11.10 CD4+ T cells using ANOVA test against “Day 0” values (=control migration) followed by Dunnett’s multiple comparison test. *p < 0.05; **p < 0.01; ***p < 0.001.
Figure 4
Figure 4
Dynamic regulation of pERM and pStathmin levels in DO11.10 CD4+ T cells. (A) Representative flow cytometry plots showing intracellular pERM levels on endogenous CD4+ versus KJ1–26+ DO11.10 CD4+ T cells on days 0, 3, and 6 post OVA/CFA immunization. The gray line represents secondary Ab only. (B) Ratio of pERM levels on endogenous CD4+ versus KJ1–26+ DO11.10 CD4+ T cells. (C) Representative flow cytometry plots showing intracellular pStathmin levels on endogenous CD4+ versus KJ1–26+ DO11.10 CD4+ T cells on days 0, 3, and 6 post OVA/CFA immunization. The gray line represents secondary Ab only. (D) Ratio of pStathmin levels on endogenous CD4+ versus KJ1–26+ DO11.10 CD4+ T cells. Data in (A,C) are representative of two independent experiments, while data in (B,D) are pooled from six mice in two independent experiments and shown as mean ± SD. Data were analyzed using ANOVA with Tukey’s multiple comparison test. ***p < 0.001.
Figure 5
Figure 5
Activation-induced decrease in T cell motility is maintained in the presence of microtubule destabilization agents, integrin blocking, and PKC inhibition. (A) Immunofluorescent analysis of microtubule networks (green) of CD4+ T cells in the presence or absence of nocodazole. Nuclei are labeled with DAPI (blue). Scale bar, 5 μm. (B) Chemokinesis of endogenous CD4+ versus KJ1–26+ DO11.10 CD4+ T cells on day 3 after OVA/CFA immunization in the presence of nocodazole or integrin-blocking mAbs. (C) Chemotaxis to 25 nM CCL21. (D) Chemokinesis of day 2 in vitro-activated lymphocytes mixed 1:20 with non-activated lymphocytes. (E) Chemotaxis of in vitro-activated lymphocytes. (F) Chemotaxis of day 2 in vitro-activated lymphocytes to 25 nM CCL21 in the presence of the PKC inhibitor BIM. No significant differences were detected. Chemokinetic migration was subtracted in (C,E,F) to focus on chemokine-induced motility. Bars represent mean ± SD of % input. Data in (B,C) are pooled from two independent experiments with five mice total and were analyzed using an unpaired Student’s t-test. Data in (D–F) are from one to three independent experiments with a total of four mice and were analyzed using ANOVA and Sidak’s multiple comparison tests. *p < 0.05; **p < 0.01; ***p < 0.001.

References

    1. Andrian Von UH, Mempel TR. Homing and cellular traffic in lymph nodes. Nat Rev Immunol (2003) 3:867–78.10.1038/nri1222 - DOI - PubMed
    1. Stein JV, Nombela-Arrieta C. Chemokine control of lymphocyte trafficking: a general overview. Immunology (2005) 116:1–12.10.1111/j.1365-2567.2005.02183.x - DOI - PMC - PubMed
    1. Cyster JG. Chemokines, sphingosine-1-phosphate, and cell migration in secondary lymphoid organs. Annu Rev Immunol (2005) 23:127–59.10.1146/annurev.immunol.23.021704.115628 - DOI - PubMed
    1. Miller MJ, Wei SH, Parker I, Cahalan MD. Two-photon imaging of lymphocyte motility and antigen response in intact lymph node. Science (2002) 296:1869–73.10.1126/science.1070051 - DOI - PubMed
    1. Miller MJ, Wei SH, Cahalan MD, Parker I. Autonomous T cell trafficking examined in vivo with intravital two-photon microscopy. Proc Natl Acad Sci U S A (2003) 100:2604–9.10.1073/pnas.2628040100 - DOI - PMC - PubMed