. 2015 Apr 9:8:238-45.
doi: 10.1016/j.nicl.2015.04.002. eCollection 2015.

Diagnostic classification of intrinsic functional connectivity highlights somatosensory, default mode, and visual regions in autism

Affiliations

Diagnostic classification of intrinsic functional connectivity highlights somatosensory, default mode, and visual regions in autism

Colleen P Chen et al. Neuroimage Clin. .

Abstract

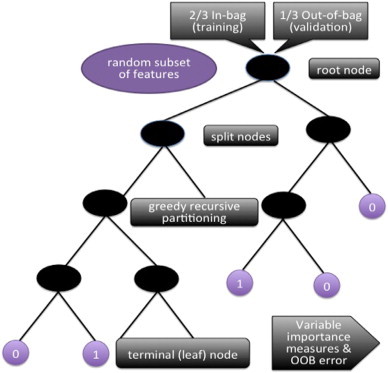
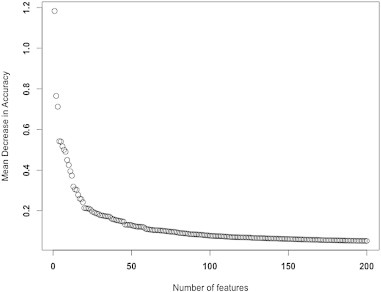
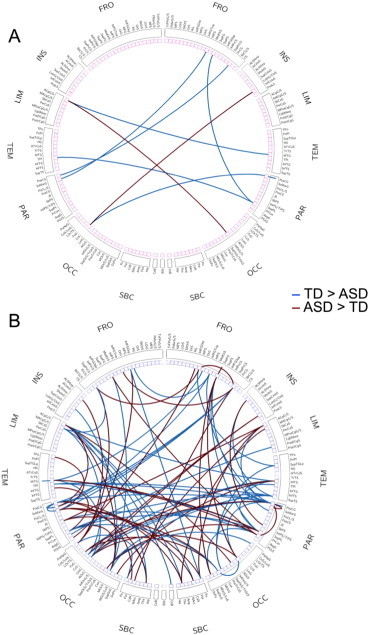
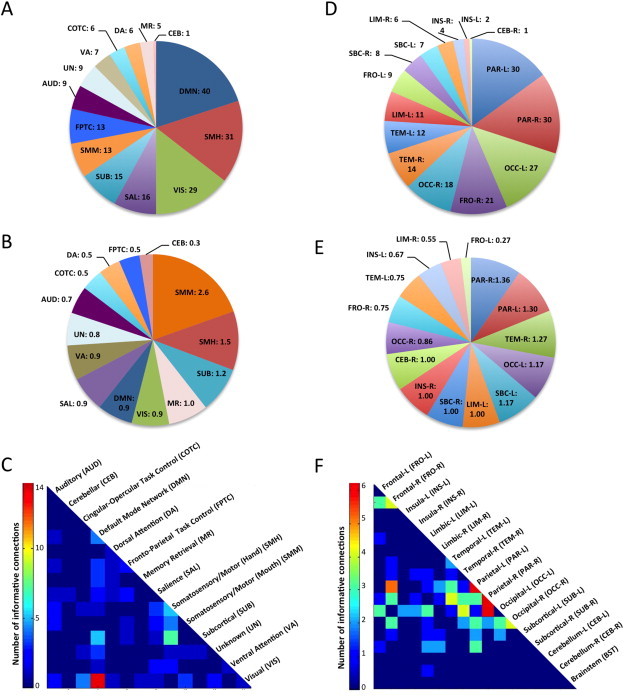
Despite consensus on the neurological nature of autism spectrum disorders (ASD), brain biomarkers remain unknown and diagnosis continues to be based on behavioral criteria. Growing evidence suggests that brain abnormalities in ASD occur at the level of interconnected networks; however, previous attempts using functional connectivity data for diagnostic classification have reached only moderate accuracy. We selected 252 low-motion resting-state functional MRI (rs-fMRI) scans from the Autism Brain Imaging Data Exchange (ABIDE) including typically developing (TD) and ASD participants (n = 126 each), matched for age, non-verbal IQ, and head motion. A matrix of functional connectivities between 220 functionally defined regions of interest was used for diagnostic classification, implementing several machine learning tools. While support vector machines in combination with particle swarm optimization and recursive feature elimination performed modestly (with accuracies for validation datasets <70%), diagnostic classification reached a high accuracy of 91% with random forest (RF), a nonparametric ensemble learning method. Among the 100 most informative features (connectivities), for which this peak accuracy was achieved, participation of somatosensory, default mode, visual, and subcortical regions stood out. Whereas some of these findings were expected, given previous findings of default mode abnormalities and atypical visual functioning in ASD, the prominent role of somatosensory regions was remarkable. The finding of peak accuracy for 100 interregional functional connectivities further suggests that brain biomarkers of ASD may be regionally complex and distributed, rather than localized.

Keywords: AUD, audio; Autism; CEB, cerebellum.; COTC, cingulo-opercular task control; DA, dorsal attention; DMN, default mode network; Default mode; FPTC, frontal parietal task control; Functional connectivity MRI; MR, memory retrieval; Machine learning; Random forest; SAL, salience; SMH, somatosensory and motor [hand]; SMM, somatosensory and motor [mouth]; SUB, subcortical; Somatosensory; UN, unknown; VA, ventral attention; VIS, visual; Visual.


Figures

Fig. S1
Fig. S1
Random Forest procedure. For each classification tree (RF’s single unit), data are bootstrapped into in-bag and out-of-bag (for testing of the model). The tree starts with the in-bag data at the root node, with a random subset of features, and begins the process of “splitting.” The splitting criteria at each node are determined by a type of greedy algorithm that recursively partitions the data into daughter nodes, until reaching a terminal node. (Greedy recursive partitioning algorithms make the partitioning choice that performs best at each split, with the goal of globally optimal classification). The out-of-bag data are then sent down the tree as a test of model fit. The misclassification rate here is called “OOB error.” This is the internal validation process that prevents overfitting. Once all 10,000 trees in the forest have finished this process, the forest takes the majority vote from the trees, and obtains variable importance measures and OOB error.
Fig. S2
Fig. S2
OOB error as a function of number of trees in the forest. Initially, the error fluctuates greatly, then eventually stabilizes with a large enough forest with 10,000 trees. Shown here are OOB errors using all 24,090 features prior to feature selection. The number of trees in the forest is an important parameter for fine-tuning to ensure stability of the algorithm. The red, green, and black lines represent the OOB errors for ASD, TD, and out-of-bag participants, respectively.
Fig. S3
Fig. S3
RF Feature selection using Mean Decrease Accuracy (MDA). In RF, variable importance is determined based on measures of mean decrease in accuracy. This is done for each tree by randomly permuting a variable in the OOB data and recording the change in accuracy. For the ensemble of trees, the permuted predictions are aggregated and compared against the unpermuted predictions to determine the importance of the permuted variable by the magnitude of the decrease in accuracy of that variable. We selected the top features using this MDA plot, where we observed stabilized rate of change of the MDA curve. Here, 100 features were selected using the MDA measures.
Fig. S4
Fig. S4
Fine tuning the mtry parameter for RF to select the optimal number of features to split at each node. Using the top 100 features, we fine tuned RF again on the parameter mtry, the number of features used at each split, to 5.
Fig. S5
Fig. S5
Connectogram showing informative connections. (A) Top 10 informative connections. (B) Top 100 informative connections. The labels of the connectograms can be found in Inline Supplementary Table S1, in the order in which they appear in the figure.
Fig. 1
Fig. 1
Informative features selected by RF. (A) Pie chart showing the number of informative ROIs per functional network. (B) Normalized number of informative ROIs per network (ratio of the number of times network ROIs participate in an informative connection divided by the total number of ROIs in given network). This number can exceed 1 because a given ROI may participate in several informative connections. (C) Heatmap of informative connections by functional networks. (D) Number of informative ROIs per anatomical parcellation. (E) Normalized number of informative ROIs per anatomical parcel (ratio of the number of times anatomical ROIs participate in an informative connection divided by the total number of ROIs in given parcel). (F) Heatmap of informative connections by anatomical parcel.

References

    1. Adolphs R., Damasio H., Tranel D., Cooper G., Damasio A.R. A role for somatosensory cortices in the visual recognition of emotion as revealed by three-dimensional lesion mapping. J. Neurosci. 2000;20(7):2683–2690. 10729349 - PMC - PubMed
    1. Akshoomoff N., Pierce K., Courchesne E. The neurobiological basis of autism from a developmental perspective. Dev. Psychopathol. 2002;14(3):613–634. 12349876 - PubMed
    1. American Psychiatric Association . Diagnostic and Statistical Manual of Mental Disorders — V. fourth edition. American Psychiatric Association; Washington, DC: 2013.
    1. Anderson J.S., Nielsen J.A., Froehlich A.L., DuBray M.B., Druzgal T.J., Cariello A.N., Cooperrider J.R., Zielinski B.A., Ravichandran C., Fletcher P.T., Alexander A.L., Bigler E.D., Lange N., Lainhart J.E. Functional connectivity magnetic resonance imaging classification of autism. Brain. 2011;134(12):3742–3754. 22006979 - PMC - PubMed
    1. Andrews-Hanna J.R., Reidler J.S., Sepulcre J., Poulin R., Buckner R.L. Functional–anatomic fractionation of the brain's default network. Neuron. 2010;65(4):550–562. 20188659 - PMC - PubMed

Publication types

LinkOut - more resources