. 2015 May 13:8:376-89.
doi: 10.1016/j.nicl.2015.05.001. eCollection 2015.

Rotation-invariant multi-contrast non-local means for MS lesion segmentation

Affiliations

Rotation-invariant multi-contrast non-local means for MS lesion segmentation

Nicolas Guizard et al. Neuroimage Clin. .

Abstract

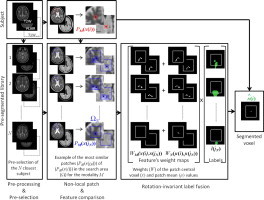
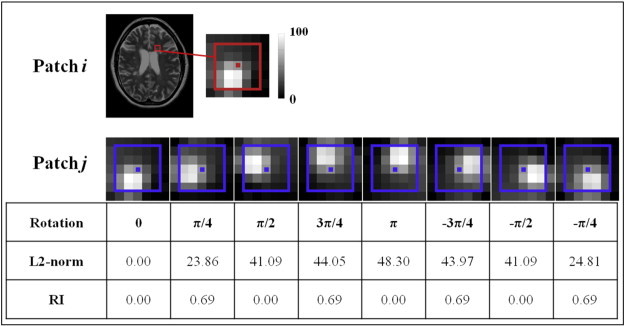
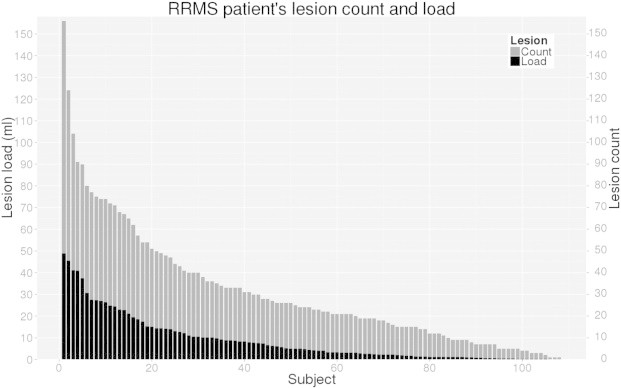
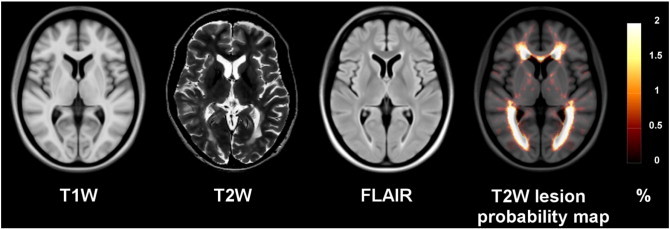
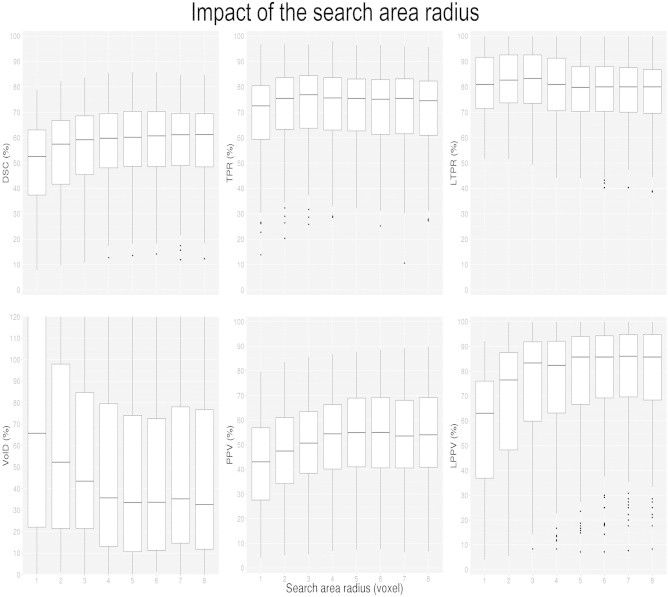
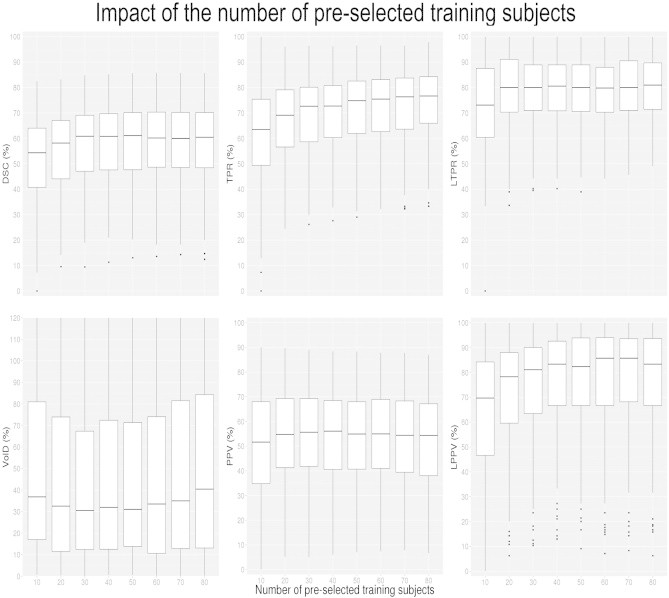
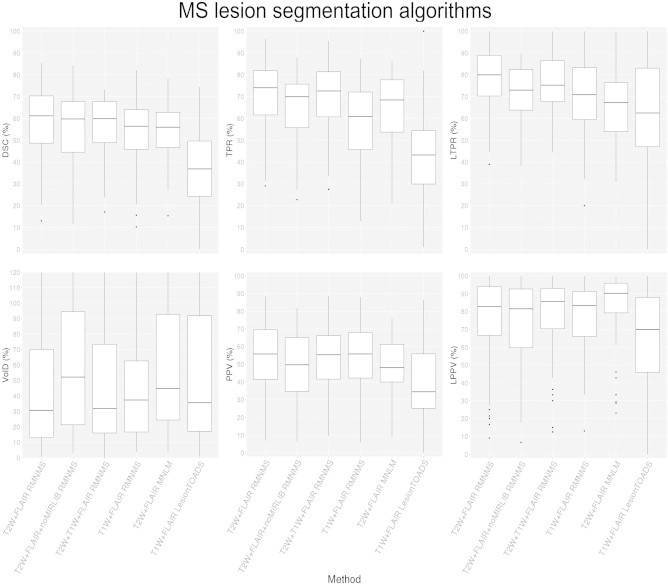
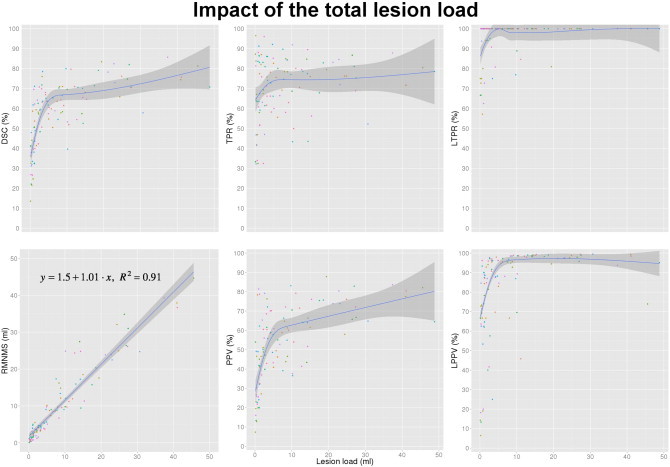
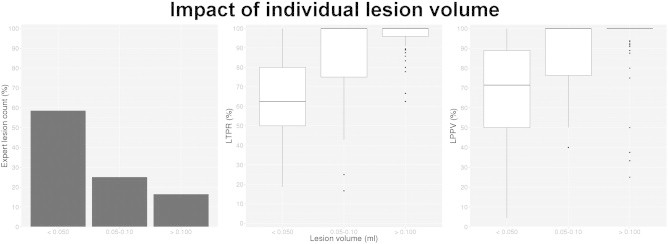
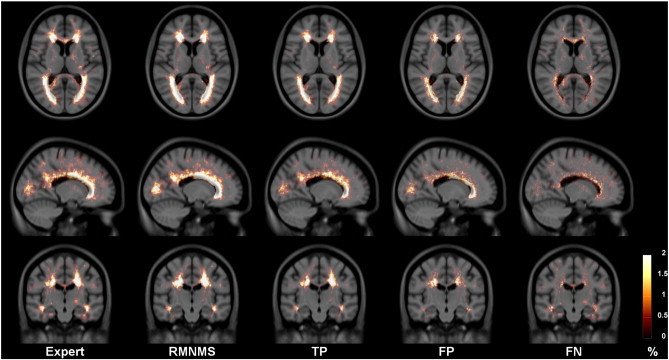
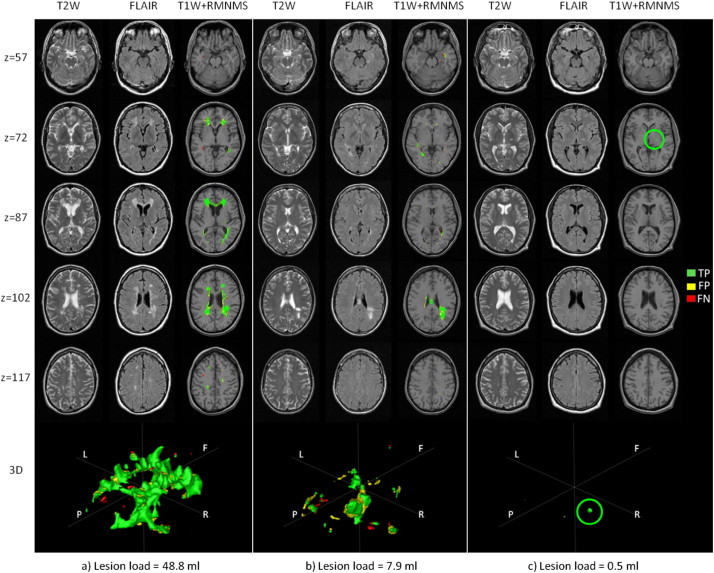
Multiple sclerosis (MS) lesion segmentation is crucial for evaluating disease burden, determining disease progression and measuring the impact of new clinical treatments. MS lesions can vary in size, location and intensity, making automatic segmentation challenging. In this paper, we propose a new supervised method to segment MS lesions from 3D magnetic resonance (MR) images using non-local means (NLM). The method uses a multi-channel and rotation-invariant distance measure to account for the diversity of MS lesions. The proposed segmentation method, rotation-invariant multi-contrast non-local means segmentation (RMNMS), captures the MS lesion spatial distribution and can accurately and robustly identify lesions regardless of their orientation, shape or size. An internal validation on a large clinical magnetic resonance imaging (MRI) dataset of MS patients demonstrated a good similarity measure result (Dice similarity = 60.1% and sensitivity = 75.4%), a strong correlation between expert and automatic lesion load volumes (R(2) = 0.91), and a strong ability to detect lesions of different sizes and in varying spatial locations (lesion detection rate = 79.8%). On the independent MS Grand Challenge (MSGC) dataset validation, our method provided competitive results with state-of-the-art supervised and unsupervised methods. Qualitative visual and quantitative voxel- and lesion-wise evaluations demonstrated the accuracy of RMNMS method.

Keywords: MRI; MS lesions; MSGC; Multi-contrast; Non-local; Patch-based; Segmentation; Supervised.


Figures

None
Graphical abstract
Fig. 1
Fig. 1
Comparison of L2-norm and RI distance. Different rotations are applied to the extracted patch i (red) to obtain the patches j (blue). The L2-norm and the RI distance metric are then computed between these two patches.
Fig. 2
Fig. 2
Lesion count and load for each RRMS subject of the clinical cohort. Only lesions with more than three connected voxels (or a lesion volume > 0.009 ml) are considered. The lesion count represents the number of non-connected lesions in grey. The lesion load represents the total volume of lesion (ml) in black. We can note that the lesion load volume is coarsely proportional to the number of lesions.
Fig. 3
Fig. 3
RRMS templates (T1W, T2W, FLAIR) and T2W lesion probability map overlay on the T1W RRMS template.
Fig. 4
Fig. 4
Impact of the search area radius (1–8 voxels) on DSC, VolD, TPR, PPV, LTPR and LPPV distributions. The boxes represent the lower and upper quartile with the median as the central black line. The whiskers extend to the most extreme data point. The experiment was conducted with a patch size radius of 1 voxel, and a pre-selection of 50 subjects.
Fig. 5
Fig. 5
Impact of the number of pre-selected training subjects on DSC, VolD, TPR, PPV, LTPR and LPPV distributions. The experiment was conducted with a patch radius of 1 voxel, and a search area radius of 5 voxels on the 108 RRMS subjects.
Fig. 6
Fig. 6
DSC, VolD, TPR, PPV, LTPR and LPPV distributions for different NLM MS lesion segmentation techniques (MNLM and RMNMS), different image modalities (T2W + FLAIR, T1W + FLAIR and T2W + T1W + FLAIR) as well as T2W + FLAIR RMNMS with (T2W + FLAIR RMNMS), without the left–right mirrored of each dataset (T2W + FLAIR+noMIRLIB RMNMS) and T1W + FLAIR LesionTOADS. The experiment was conducted on the 108 RRMS subjects, and for the NLM approaches a patch radius of 1 voxel, and a search area radius of 5 voxels were chosen.
Fig. 7
Fig. 7
Impact of the lesion load on DSC, manual lesion load linear correlation with RMNMS, TPR, PPV, LTPR and LPPV. The experiment was conducted with a patch radius of 2 voxels, a search area radius of 5 voxels and a pre-selection of 50 training subjects on the 108 RRMS subjects (represented by colored dots on the graph). The blue line represents a non-parametric fitting using a nearest neighbour approach with a locally weighted regression for DSC, TPR and PPV and a linear fitting for the linear regression of the manual lesion load and RMNMS lesion volume. The darker grey shading represents the 95% confidence and for the linear correlation, the slope, the intercept and the residual error (R2) are provided on the graph.
Fig. 8
Fig. 8
Expert segmentation lesion count, LTPR and LPPV per lesion size groups. The plot on the left shows the manually outline lesion count per each lesion volume group (<0.05, 0.05–0.10, >0.10 ml), averaged across all subjects. The LTPR and LPPV measurement experiments were conducted with a patch radius of 1 voxel, a search area radius of 5 voxels and a pre-selection of 50 training subjects on the 108 RRMS subjects.
Fig. 9
Fig. 9
Expert and RMNMS, TP, FP and FN lesion segmentation probability maps for the 108 RRMS patients. All the maps are displayed within the same range and overlaid on the RRMS template T1W.
Fig. 10
Fig. 10
Segmentation results for 3 RRMS cases. a) The largest (48.8 ml), b) median (7.9 ml and c) the smallest (0.5 ml) lesion load of the cohort. The figure shows axial slices (“z” is the z-coordinate in mm in the MNI space) for T2W, FLAIR and T1W combined with the automatic RMNMS segmentation (“T1W + RMNMS”) and 3D rendering of the segmentations (orientation is defined such as F = frontal, P = posterior, R = surgical right and L = surgical left). The overlapping voxels (TP) with the manual segmentation are represented in green, while the false positives (FP) are yellow and the false negatives (FN) are red. The green circle highlights the TP of the unique lesion for subject “c”. The experiment was conducted with a patch radius of 1 voxel, a search area radius of 5 voxels and a pre-selection of 50 training subjects on the 108 RRMS subjects.

References

    1. Aljabar P., Heckemann R.A., Hammers A., Hajnal J.V., Rueckert D. Multi-atlas based segmentation of brain images: atlas selection and its effect on accuracy. Neuroimage. 2009;46(3):726–738. 19245840 - PubMed
    1. Bai W., Shi W., O'Regan D.P., Tong T., Wang H., Jamil-Copley S., Peters N.S., Rueckert D. A probabilistic patch-based label fusion model for multi-atlas segmentation with registration refinement: application to cardiac MR images. I.E.E.E. Transactions Med. Imaging. 2013;32(7):1302–1315. 23568495 - PubMed
    1. Bazin P.-L., Pham D.L. Homeomorphic brain image segmentation with topological and statistical atlases. Med. Image Anal. 2008;12(5):616–625. 18640069 - PMC - PubMed
    1. Borgefors G. Hierarchical chamfer matching: a parametric edge matching algorithm. IEEE Trans. Pattern Anal. Machine Intell. 1988;10(6):849–865.
    1. Buades A., Coll B., Morel J.M. CVPR 2005. I.E.E.E. Computer Society Conference. IEEE; 2005. A non-local algorithm for image denoising. Computer vision and pattern recognition.

Publication types

MeSH terms