. 2015 Jul 2;523(7558):47-52.
doi: 10.1038/nature14548. Epub 2015 Jun 24.

The architecture of the spliceosomal U4/U6.U5 tri-snRNP

Affiliations

The architecture of the spliceosomal U4/U6.U5 tri-snRNP

Thi Hoang Duong Nguyen et al. Nature. .

Abstract

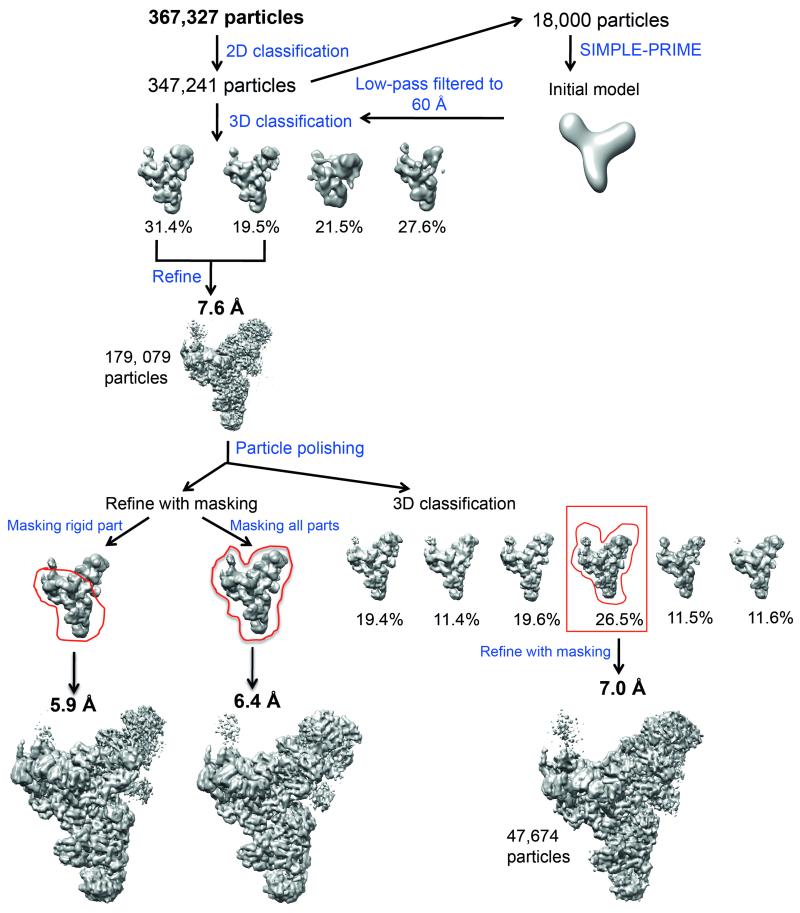
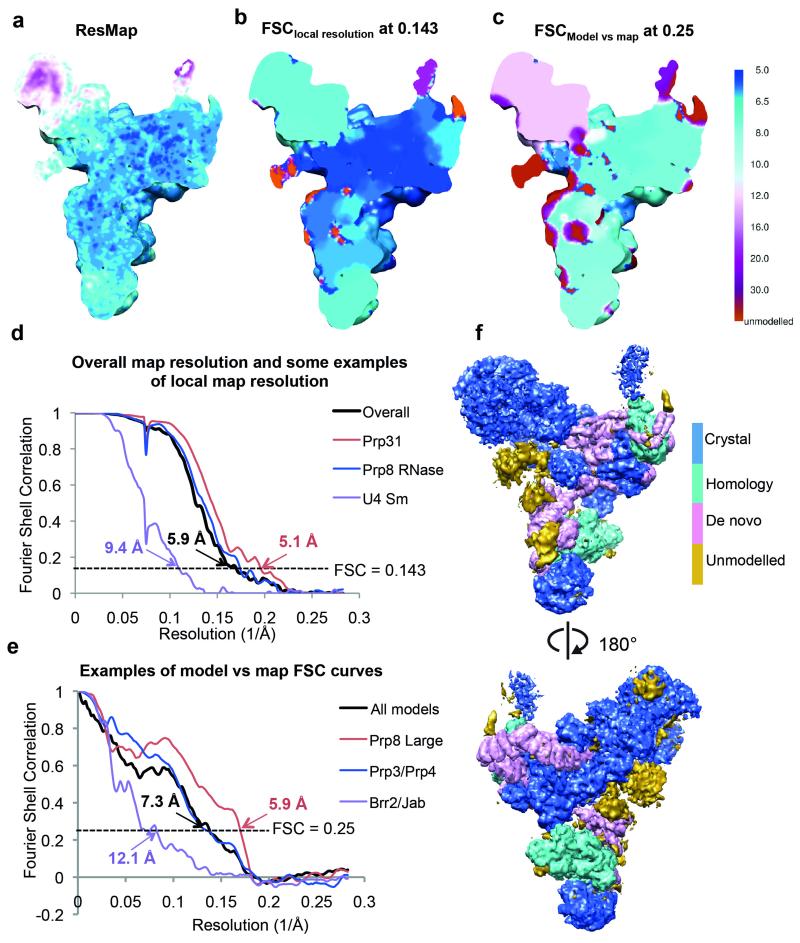
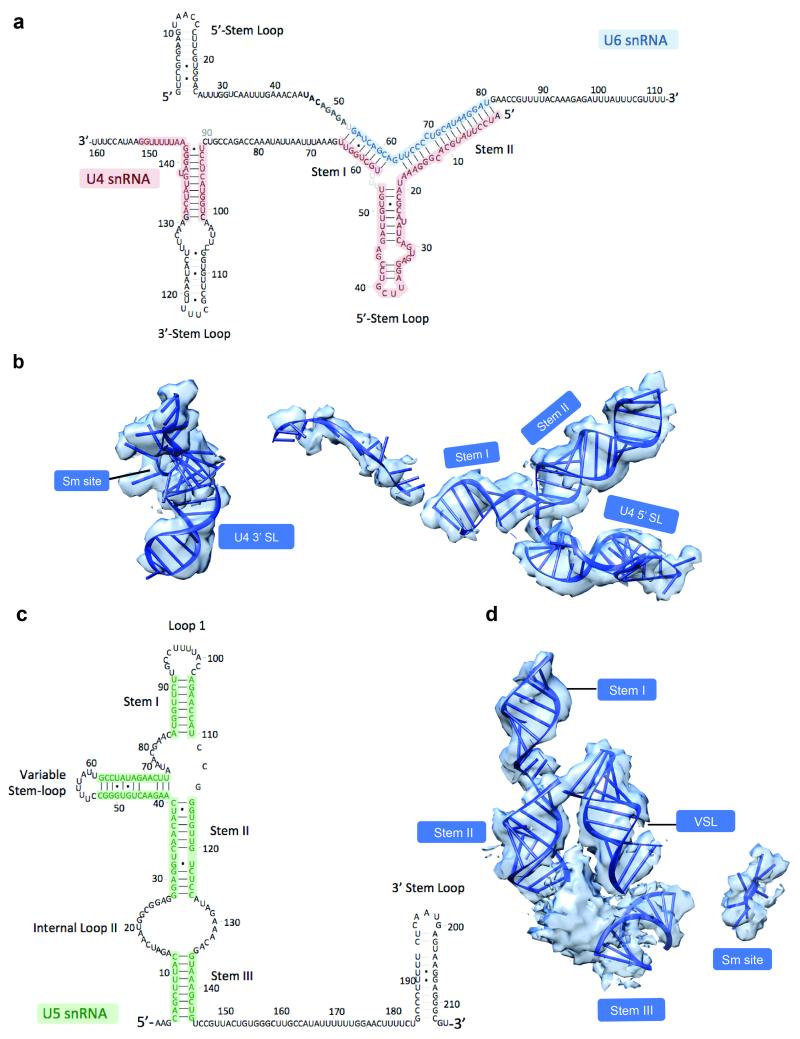
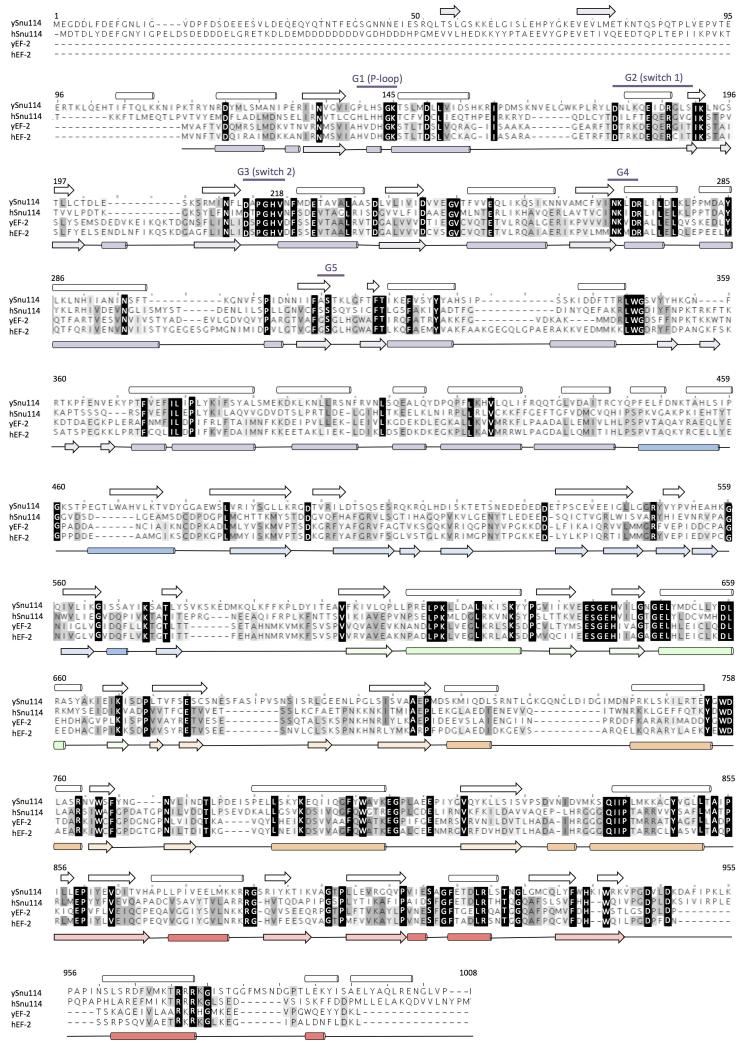
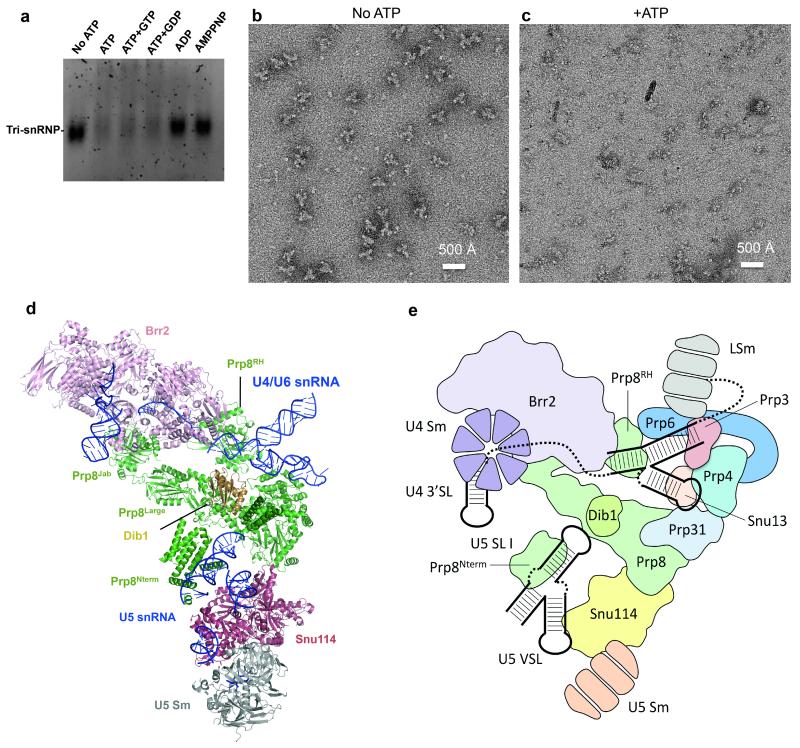
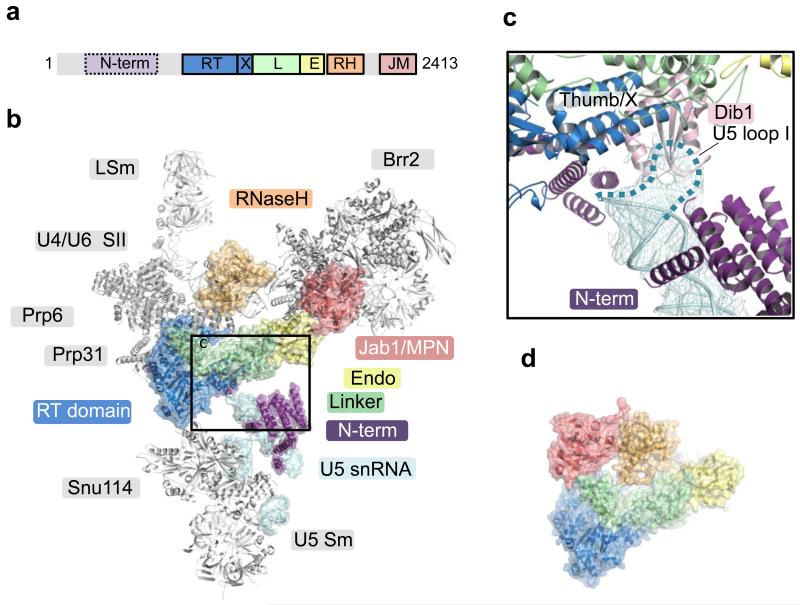
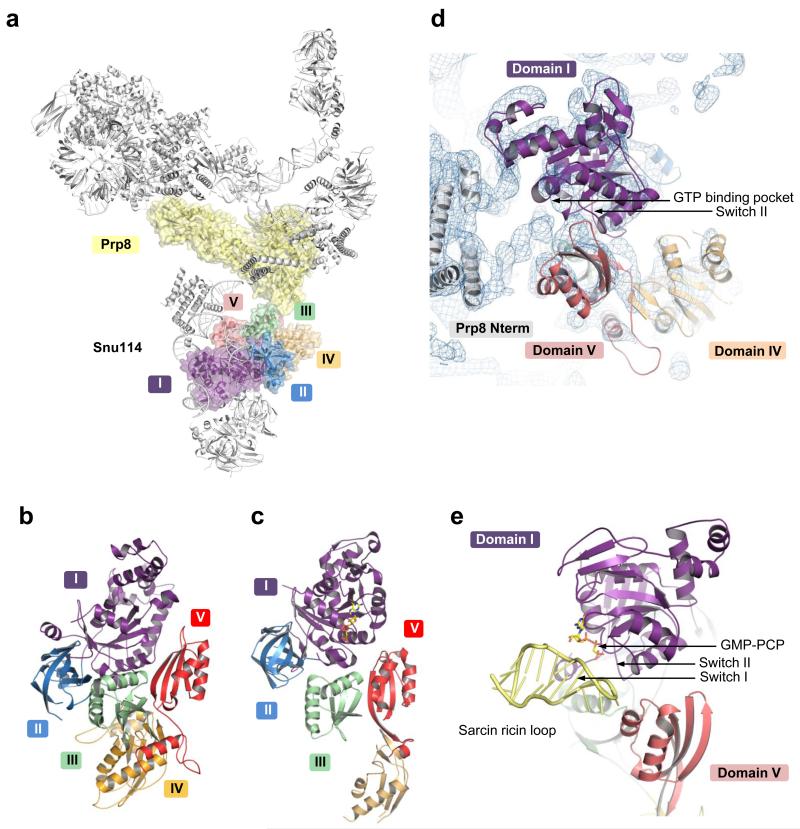
U4/U6.U5 tri-snRNP is a 1.5-megadalton pre-assembled spliceosomal complex comprising U5 small nuclear RNA (snRNA), extensively base-paired U4/U6 snRNAs and more than 30 proteins, including the key components Prp8, Brr2 and Snu114. The tri-snRNP combines with a precursor messenger RNA substrate bound to U1 and U2 small nuclear ribonucleoprotein particles (snRNPs), and transforms into a catalytically active spliceosome after extensive compositional and conformational changes triggered by unwinding of the U4 and U6 (U4/U6) snRNAs. Here we use cryo-electron microscopy single-particle reconstruction of Saccharomyces cerevisiae tri-snRNP at 5.9 Å resolution to reveal the essentially complete organization of its RNA and protein components. The single-stranded region of U4 snRNA between its 3' stem-loop and the U4/U6 snRNA stem I is loaded into the Brr2 helicase active site ready for unwinding. Snu114 and the amino-terminal domain of Prp8 position U5 snRNA to insert its loop I, which aligns the exons for splicing, into the Prp8 active site cavity. The structure provides crucial insights into the activation process and the active site of the spliceosome.


Figures

Extended Data Figure 1
Extended Data Figure 1. U4/U6.U5 tri-snRNP sample used for this study
a, Coomassie-blue stained SDS-PAGE gel showing protein composition of the purified tri-snRNP. U5-, U4/U6- and tri-snRNP-specific proteins are labeled in blue, red and teal, respectively. Sm proteins present in both U5 and U4/U6 are in black. b, Toluidine-blue stained denaturing acrylamide (9%) gel showing RNA compositions. c, Electron cryo-micrograph of tri-snRNP where the carbon coated grid was discharged in N-amylamine. d, and e, Reference-free two-dimensional class averages of a data set collected on a grid discharged in air and N-amylamine, respectively.
Extended Data Figure 2
Extended Data Figure 2. Classification and refinement procedures used in this study
A total of 367,327 particles were subjected to reference-free 2D classification. A subset of 347,241 particles from good 2D classes was selected for 3D classification using an initial model obtained from SIMPLE-PRIME, which was low-pass filtered to 60 Å. The data was divided into four 3D classes, two of which (a total of 179,079 particles) showed better features and were combined for refinement. This resulted in a 7.6 Å reconstruction. To further improve the reconstruction, these particles were subjected to beam-induced motion correction (particle polishing). Refinement of these polished particles with a soft mask around the rigid part of the map (as indicated by the red envelope) yielded a 5.9 Å reconstruction while refinement with a mask around the whole map yielded a 6.4 Å reconstruction. The polished particles were also subject to further 3D classification with a finer angular sampling of 1.8°. The most populated class (47,674 particles), which also has the best rotational accuracy, was refined with a soft mask around the whole density. This resulted in a 7.0 Å reconstruction. In this study, the 5.9 Å reconstruction was used for subsequent biological interpretation. All steps were performed in RELION unless otherwise stated.
Extended Data Figure 3
Extended Data Figure 3. CryoEM maps and tilt-pair validation
a, CryoEM density of the whole tri-snRNP at 5.9 Å resolution by “gold standard” Fourier Shell Correlation (FSC) of 0.143 criterion at two different contour levels. The high contour map (gold) shows well-resolved densities for protein and RNA helices and flat densities for beta-sheets. The low contour map (silver) shows densities for the more flexible head and arm. The map was sharpened by a B-factor of −214 Å2 and low-pass filtered to 5.9 Å as determined by RELION. b, The unsharpened full map of tri-snRNP. c, The map resulting from multi-body refinement, in which tri-snRNP is divided into four parts: the head, body, arm and foot. This resulted in better density for the arm domain (indicated by red circles), which is at 20 Å resolution. d, Tilt-pair validation plot for tri-snRNP. This was obtained from 1196 particles from 32 micrograph pairs, imaged at 0° and 10° tilt angles. The position of each dot represents the direction and the amount of tilting for a particle pair in polar coordinates. Blue dots correspond to in-plane tilt transformations; red and purple dots correspond to out-of-plane tilt transformations. Blue dots cluster in the same region of the plot at a tilt angle of approximately 10° as indicated by the red circle.
Extended Data Figure 4
Extended Data Figure 4. Resolution estimation of tri-snRNP map
a, Local resolution of the tri-snRNP map estimated by ResMap using the color scheme shown in panel c. b, Local resolution of the tri-snRNP map calculated by “gold-standard” FSC. For each component of the map that we modeled protein/RNA components, a soft mask (with a 30-pixel soft-edge) surrounding the region of interest was prepared and used for FSC calculations. Convolution effects of the masks on the FSC curves were corrected using high-resolution noise substitution. Resolution was estimated at FSC=0.143. Local resolution for the unmodeled region of the map (in red) was not estimated. c, Local resolution of model versus map. The map of each modeled component was extracted from the map using a soft mask (with a 5-pixel soft-edge) surrounding the component. The model was converted into density by EMAN. FSC of model versus map was calculated using Xmipp. The map is colored according to resolution estimates based on a FSC threshold of 0.25. The lower resolution estimates from the FSC of model versus map compared to the estimates from ResMap and the gold-standard FSCs are explained by the nature of our models. Because of the limited resolution of our map, we did not perform full atomic refinement, but placed known crystal structures and homology models as rigid bodies in the map. d, Gold-standard FSC curves for the whole tri-snRNP map and some of its components calculated as described in b. e, FSC curves of model versus map for the whole model and some of the components. f, The full tri-snRNP map in which portions of the structure produced from crystal structures, homology modeling and de-novo building or unmodeled are colored as indicated.
Extended Data Figure 5
Extended Data Figure 5. Fitting of protein components into tri-snRNP map
a, Prp8885-2413 crystal structure (PDB ID: 4I43, green) and additional helices built de novo assigned to the N-terminus of Prp8 (blue). b, Brr2-Jab1/MPN complex (PDB ID: 4BGD). c, Snu114 homology model based on EF2 (ref. 26). d, The Prp6 TPR motifs built into the tri-snRNP map. e, U5 Sm proteins (grey) with Sm site (blue) based on the human U4 Sm structure (PDB ID: 4WZJ). f, Dib1 (ref. 29) (PDB ID: 1QGV). g, i, Prp31. ii, Comparison between the crystal structure of human Prp3178-333 (ref. 33) (PDB ID: 2OZB, grey) and that in tri-snRNP (yellow and blue). The coiled-coil domain (yellow) rotates by 60° in tri-snRNP with respect to the Nop domain (grey). Additional helices (blue) that extend from the N- and C-termini were built. h, U4 Sm proteins with part of U4 snRNA (blue) based on the human U4 Sm structure. i, Prp3 model. The ferredoxin-like domain was obtained from homology modeling while the extra helices were built de novo. j, Prp4 WD40 homology model with the extra helices built de novo. k, Snu13 (ref. 64) (PDB ID: 2ALE). l, U6 LSm proteins (PDB ID: 4M77).
Extended Data Figure 6
Extended Data Figure 6. Fitting of the RNA components in tri-snRNP map
a, and c, The sequences and predicted secondary structures of U4/U6 snRNA and the long version of U5 snRNA, respectively. b, and d, The maps of the fitted parts of U4/U6 snRNA and U5 snRNA, respectively. Unmodeled density assigned to U5 snRNA was also shown in d.
Extended Data Figure 7
Extended Data Figure 7. Sequence alignment of yeast and human Snu114 with yeast and human elongation factor 2 (EF-2)
The secondary structures of our homology model for yeast Snu114 and the yeast EF-2 (ref. 26) (PDB ID: 1N0V) are shown on the top and bottom of the alignment, respectively. Important sequence elements are also shown.
Extended Data Figure 8
Extended Data Figure 8. The effect of ATP on Brr2-TAPS purified tri-snRNP
a, Ethidium-bromide stained native agarose gel (0.5%) showing the effects of ATP addition to Brr2-TAPS purified tri-snRNP used in this study. Upon ATP addition either without or with GTP/GDP, tri-snRNP fell apart (lanes 1-4). Under the same conditions, the addition of ADP or the non-hydrolysable ATP-analogue, AMPPNP had no effects on the complex (lanes 5-6). b, and c, The effect of ATP addition observed by negative stain microscopy. When ATP was not present, tri-snRNP particles could be observed. When ATP was added to the sample prior to grid preparations, tri-snRNP particles fell apart as observed by many small components on the micrograph rather than tri-snRNP particles. d, Tri-snRNP model where U4/U6 snRNP proteins are not shown. In tri-snRNP, Brr2/Prp8Jab complex is loosely associated to the remaining of U5 snRNP components including Prp8large, Prp8RNaseH, Prp8Nterm, Snu114, Dib1, U5 Sm proteins and U5 snRNA. After U4/U6 snRNA unwinding by Brr2, Brr2/Prp8Jab could be repositioned within the spliceosome. e, A schematic showing the arrangement of tri-snRNP protein and RNA components.
Figure 1
Figure 1. Overview of the U4/U6.U5 tri-snRNP structure with its protein and RNA components modeled into cryo-EM density
a, Front view, facing concave surface; b, back view; c, top view. d, 2D class average showing the different domains of tri-snRNP: head, body, arm and foot.
Figure 2
Figure 2. Prp8 in tri-snRNP
a, Domain organization of Prp8. The structure of the N-terminal domain (residues 1-884) is unknown. RT, Reverse transcriptase-like domain; X, Thumb/X; L, linker, RH, RNaseH-like; JM, Jab1/MPN domains. b, The large domain of Prp8 is located at the centre of tri-snRNP. The Jab1/MPN domain is bound to Brr2 (ref. 31,32). c, Inset, Loop 1 of U5 snRNA is inserted to the active site cavity and in contact with Dib1. d, Prp8 in the Prp8/Aar2 complex is shown with its large domain in the same orientation as in b. In tri-snRNP, the RNaseH domain is inverted while the Jab1/MPN domain in complex with Brr2 is located at the opposite end of the large domain.
Figure 3
Figure 3. The snRNA components of U4/U6.U5 tri-snRNP
a, Secondary structures of U4/U6 and U5 snRNAs. b, Double-stranded regions of U4/U6 and U5 snRNAs modeled into the cryo-EM map.
Figure 4
Figure 4. Structure of Snu114 in tri-snRNP
a, Location of Snu114 in the U4/U6.U5 tri-snRNP. b, Arrangement of Domains (I-V) in Snu114 (see Extended Data Fig. 7). c, Domain arrangement in EF-G bound to the ribosome. d, The interface between the N-terminal domain of Prp8 and Snu114. Some of the uninterpreted density at the interface may be attributed to the unmodeled switch I loop. e, The interaction of the switch region of EF-G with the sarcin-ricin loop for GTPase activation.
Figure 5
Figure 5. Brr2 mode of unwinding
a, Domain organisation of Brr2 N-terminal helicase cassette (NHC). WH, Winged-helix; HLH, helix-loop-helix; and FN3, fibronectin3-like domains. The inactive C-terminal helicase cassette (CHC) has the same domain organisation. b, U4/U6 di-snRNP and its interaction with Brr2 in tri-snRNP. The domains of Brr2 NHC are coloured as in a. The single-stranded RNA between U4/U6 stem I and U4 3′SL is already loaded in the active site of Brr2. When the Hel308 structure is overlaid onto the NHC of Brr2, its 10-nucleotide DNA substrate coincide with the density in the Brr2 active site, which extends to U4 snRNA 3′SL (red dotted line). The helix-loop-helix domain of Brr2 interacts with U4 snRNA 3′SL (inset). c, Superposition of the RecA1 domain of Brr2 in the crystal structure (PDB ID 4BGD, in grey) and in tri-snRNP (domains coloured as in a) shows the opening of the gap between the RecA1 and RecA2 domains (indicated by the red arrow) to accommodate the RNA substrate.
Figure 6
Figure 6. Insights into activation mechanism and the active site of the spliceosome
a, Mapping of the U4-cs1 suppressor mutations on the surface of Prp8. Three clusters of mutations are found in close proximity to the key elements of spliceosomal activation: Prp31/U4snRNA 5′SL, Snu114, and ACAGAGA box of the U6 snRNA. b, A model of the catalytic core of group II intron docked into the active site cavity by superposition of the EBS1 stem of group II intron (PDB ID 3IGI) and stem I of the U5 snRNA.

References

    1. Will CL, Lührmann R. Spliceosome structure and function. Cold Spring Harb. Perspect. Biol. 2011;3:pii: a003707. - PMC - PubMed
    1. Chan SP, Cheng SC. The Prp19-associated complex is required for specifying interactions of U5 and U6 with pre-mRNA during spliceosome activation. J. Biol. Chem. 2005;280:31190–31199. - PubMed
    1. Fabrizio P, Dannenberg J, Dube P, Kastner B, Stark H, Urlaub H, Lührmann R. The evolutionarily conserved core design of the catalytic activation step of the yeast spliceosome. Mol. Cell. 2009;36:593–608. - PubMed
    1. Fica SM, Tuttle N, Novak T, Li NS, Lu J, Koodathingal P, Dai Q, Staley JP, Piccirilli JA. RNA catalyses nuclear pre-mRNA splicing. Nature. 2013;503:229–234. - PMC - PubMed
    1. Newman AJ, Norman C. U5 snRNA interacts with exon sequences at 5′ and 3′ splice sites. Cell. 1992;68:743–754. - PubMed

Additional References

    1. Schreieck A, et al. RNA polymerase II termination involves C-terminal domain tyrosine dephosphorylation by CPF subunit Glc7. Nat. Struct. Mol. Biol. 2014;21:175–179. - PMC - PubMed
    1. Mindell JA, Grigorieff N. Accurate determination of local defocus and specimen tilt in electron microscopy. J. Struct. Biol. 2003;142:334–347. - PubMed
    1. Elmlund H, Elmlund D, Bengio S. PRIME: probabilistic initial 3D model generation for single-particle cryo-electron microscopy. Structure. 2013;21:1299–1306. - PubMed
    1. Kucukelbir A, Sigworth FJ, Tagare HD. Quantifying the local resolution of cryo-EM density maps. Nature Methods. 2014;11:63–65. - PMC - PubMed
    1. Chen S, et al. High-resolution noise substitution to measure overfitting and validate resolution in 3D structure determination by single particle electron cryomicroscopy. Ultramicroscopy. 2013;135:24–35. - PMC - PubMed

Publication types

MeSH terms

Substances