. 2015 Jun 24;11(6):e1005272.
doi: 10.1371/journal.pgen.1005272. eCollection 2015 Jun.

Dissection of a Complex Disease Susceptibility Region Using a Bayesian Stochastic Search Approach to Fine Mapping

Affiliations

Dissection of a Complex Disease Susceptibility Region Using a Bayesian Stochastic Search Approach to Fine Mapping

Chris Wallace et al. PLoS Genet. .

Abstract

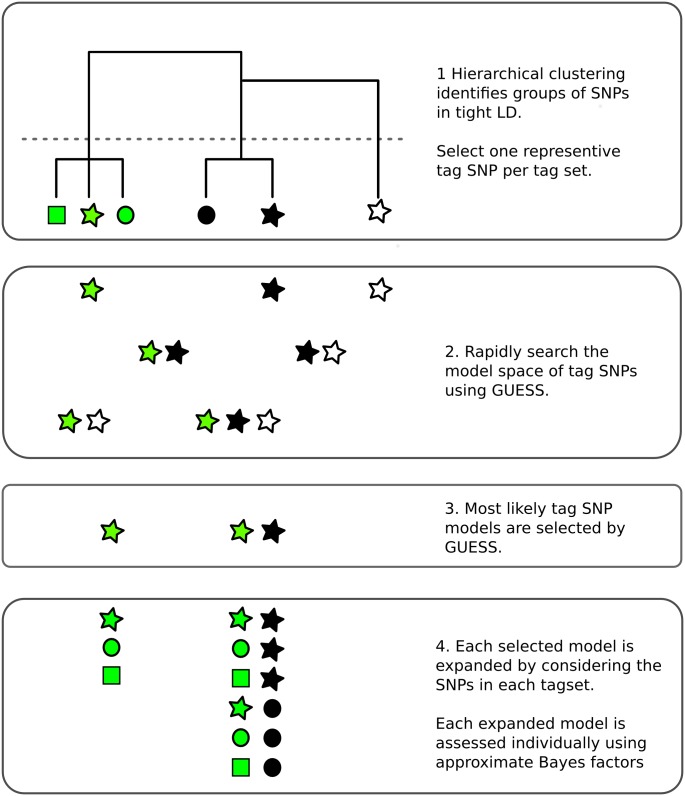
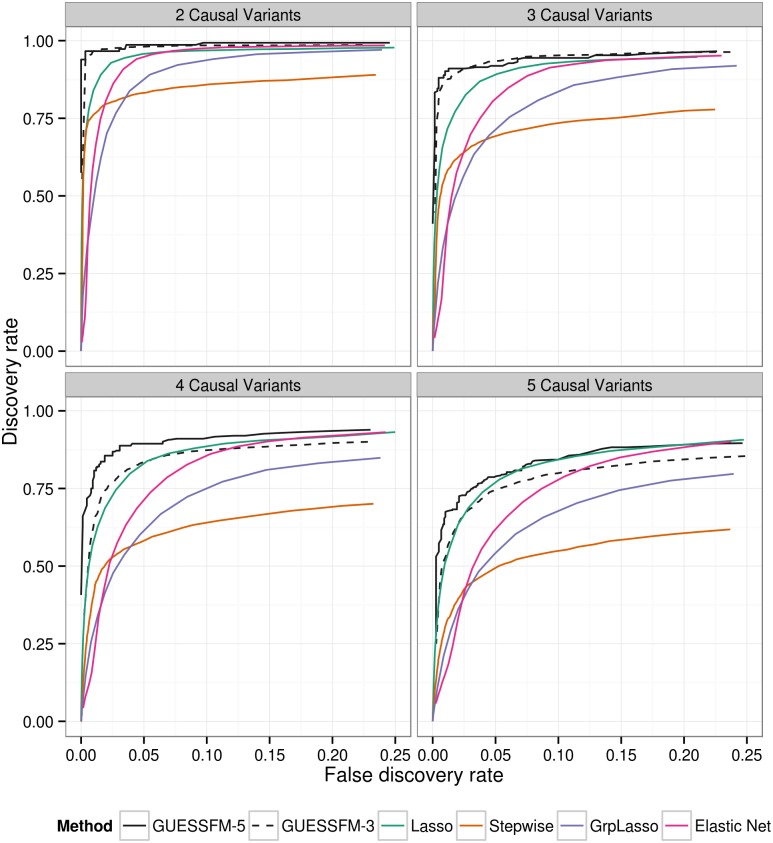
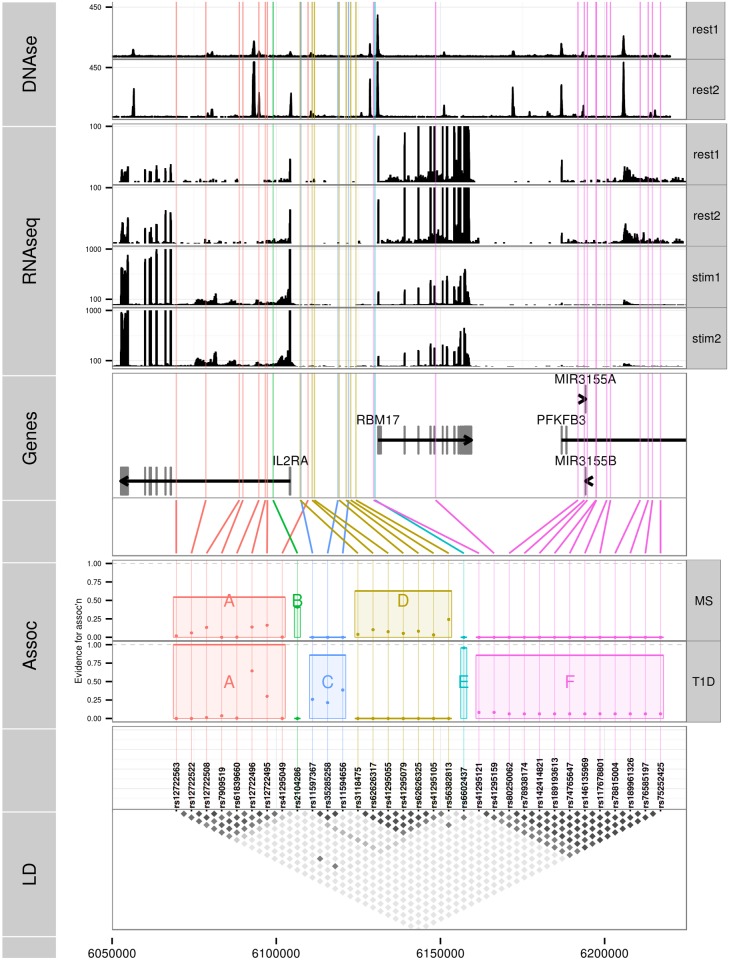
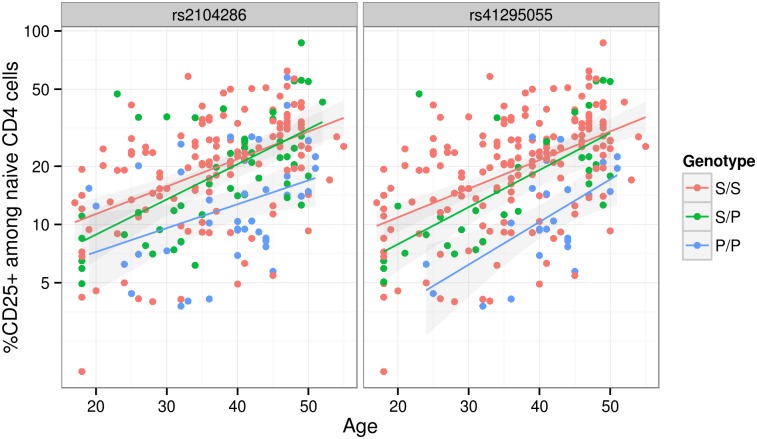
Identification of candidate causal variants in regions associated with risk of common diseases is complicated by linkage disequilibrium (LD) and multiple association signals. Nonetheless, accurate maps of these variants are needed, both to fully exploit detailed cell specific chromatin annotation data to highlight disease causal mechanisms and cells, and for design of the functional studies that will ultimately be required to confirm causal mechanisms. We adapted a Bayesian evolutionary stochastic search algorithm to the fine mapping problem, and demonstrated its improved performance over conventional stepwise and regularised regression through simulation studies. We then applied it to fine map the established multiple sclerosis (MS) and type 1 diabetes (T1D) associations in the IL-2RA (CD25) gene region. For T1D, both stepwise and stochastic search approaches identified four T1D association signals, with the major effect tagged by the single nucleotide polymorphism, rs12722496. In contrast, for MS, the stochastic search found two distinct competing models: a single candidate causal variant, tagged by rs2104286 and reported previously using stepwise analysis; and a more complex model with two association signals, one of which was tagged by the major T1D associated rs12722496 and the other by rs56382813. There is low to moderate LD between rs2104286 and both rs12722496 and rs56382813 (r2 ≃ 0:3) and our two SNP model could not be recovered through a forward stepwise search after conditioning on rs2104286. Both signals in the two variant model for MS affect CD25 expression on distinct subpopulations of CD4+ T cells, which are key cells in the autoimmune process. The results support a shared causal variant for T1D and MS. Our study illustrates the benefit of using a purposely designed model search strategy for fine mapping and the advantage of combining disease and protein expression data.


Conflict of interest statement

The authors have declared that no competing interests exist.

Figures

Fig 1
Fig 1. Overview of the fine mapping tailored stochastic search strategy in GUESSFM.
1. SNPs are clustered based on genotype data. Tagging is used to remove cases of extreme LD (r 2 > 0.99) by selecting one SNP from each cluster (“tag set”), that which is in highest average r 2 with all other SNPs. 2. All possible models that can be formed from the tag SNPs may be considered by GUESS. Here, all seven possible models are considered but, in practice, with larger numbers of tags than shown here, GUESS employs a stochastic search strategy to consider only a subset of models, prioritising those with greatest statistical support. 3. GUESS selects the most likely models amongst those it has visited. Here, it selects two of the seven, but in larger data sets we retain the 30,000 most likely. 4. Each of these selected models is expanded by considering all possible substitutions of tags by other members of their tag set. Each expanded model is then assessed again individually, using an approximate Bayes factor [14].
Fig 2
Fig 2. Comparison of of several multivariate methods for fine mapping using simulated data.
We simulated quantitative phenotype data with between two and five causal variants using genotype data from the T1D dataset for the IL2RA region. The simulated data sets were analysed using forward stepwise regression, GUESSFM, the lasso, the group lasso and the elastic net. GUESSFM produces credible sets for each variant chosen using the snp.picker algorithm described in Materials and Methods. We defined pseudo “credible sets” for the other approaches as the set of SNPs with r 2 > 0.8 with a selected SNP. We calculated the discovery rate (the proportion of causal variants within at least one credible set, y axis) and false discovery rate (proportion of detected variants whose credible sets did not contain any causal variant, x axis) at different thresholds for the stepwise p value, the group marginal posterior probability of inclusion (gMPPI) for GUESSFM and the regularization parameter(s) across simulated datasets (see Methods for details). GUESSFM-3 and GUESSFM-5 refer to GUESSFM run with a prior expectation of three or five causal variants per region, respectively. Results are averaged over 1000 replicates.
Fig 3
Fig 3. Six sets of SNPs can best explain the association of T1D and MS in the chromosome 10p15 region.
LD: a heatmap indicating the r 2 between SNPs. Assoc: MPPI for MS and T1D the SNPs in a group, with total MPPI across a SNP group, gMPPI, indicated by the height of the shaded rectangle (see Table 5 for numerical details). SNP groups are labelled by the letters A-F for reference. SNPs in this track are ordered by SNP group for ease of visualisation. Genes: SNPs are mapped back to physical position and shown in relation to genes in the region. RNAseq: read counts in two pooled replicates of resting (“rest1” and “rest2”) and anti-CD3/CD28 stimulated (“stim1” and “stim2”) CD4+ T cells; y axes were truncated to allow visualization of intronic read counts. Note the different limits for resting and stimulated cells, which show greater transcription of all protein coding genes in the region. DNase: DNase hypersensitivity measured in CD4 cells by the Roadmap consortium. Replicate 1 (“rest1”) is RO_01689; replicate 2 (“rest2”) is RO_01736; y axes were truncated again to improve visualization.
Fig 4
Fig 4. The proportion of naive CD4+ T cells that express CD25 (log scale) increases with age.
The MS protective allele for the M2 SNP rs41295055:C > T associates with fewer CD4+ T cells expressing CD25 across all ages (p = 3.45 × 10⁻⁸), and is statistically preferred to the previously reported M1 SNP, rs2104286:T > C (p = 2.56 × 10⁻⁶; Δ BIC = 8.43). S and P are used to represent the (common) MS-susceptible and (rare) MS-protective alleles respectively at each SNP. These SNPs are in limited LD (r 2 = 0.3).

References

    1. Thurman RE, Rynes E, Humbert R, Vierstra J, Maurano MT, et al. (2012) The accessible chromatin landscape of the human genome. Nature 489: 75–82. 10.1038/nature11232 - DOI - PMC - PubMed
    1. McCarthy MI, Hirschhorn JN (2008) Genome-wide association studies: potential next steps on a genetic journey. Hum Mol Genet 17: R156–R165. 10.1093/hmg/ddn289 - DOI - PMC - PubMed
    1. Miller AJ (1984) Selection of subsets of regression variables. Journal of the Royal Statistical Society Series A (General) 147: pp. 389–425. 10.2307/2981576 - DOI
    1. Wellcome Trust Case Control Consortium, Maller JB, McVean G, Byrnes J, Vukcevic D, et al. (2012) Bayesian refinement of association signals for 14 loci in 3 common diseases. Nat Genet 44: 1294–1301. 10.1038/ng.2435 - DOI - PMC - PubMed
    1. Pickrell JK (2014) Joint analysis of functional genomic data and genome-wide association studies of 18 human traits. Am J Hum Genet 94: 559–573. 10.1016/j.ajhg.2014.03.004 - DOI - PMC - PubMed

Publication types

MeSH terms

Substances