. 2015 Jun 24;10(6):e0131241.
doi: 10.1371/journal.pone.0131241. eCollection 2015.

Dual fatty acid synthase and HER2 signaling blockade shows marked antitumor activity against breast cancer models resistant to anti-HER2 drugs

Affiliations

Dual fatty acid synthase and HER2 signaling blockade shows marked antitumor activity against breast cancer models resistant to anti-HER2 drugs

Adriana Blancafort et al. PLoS One. .

Abstract

Blocking the enzyme Fatty Acid Synthase (FASN) leads to apoptosis of HER2-positive breast carcinoma cells. The hypothesis is that blocking FASN, in combination with anti-HER2 signaling agents, would be an effective antitumor strategy in preclinical HER2+ breast cancer models of trastuzumab and lapatinib resistance. We developed and molecularly characterized in vitro HER2+ models of resistance to trastuzumab (SKTR), lapatinib (SKLR) and both (SKLTR). The cellular interactions of combining anti-FASN polyphenolic compounds (EGCG and the synthetic G28UCM) with anti-HER2 signaling drugs (trastuzumab plus pertuzumab and temsirolimus) were analyzed. Tumor growth inhibition after treatment with EGCG, pertuzumab, temsirolimus or the combination was evaluated in two in vivo orthoxenopatients: one derived from a HER2+ patient and another from a patient who relapsed on trastuzumab and lapatinib-based therapy. SKTR, SKLR and SKLTR showed hyperactivation of EGFR and p-ERK1/2 and PI3KCA mutations. Dual-resistant cells (SKLTR) also showed hyperactivation of HER4 and recovered levels of p-AKT compared with mono-resistant cells. mTOR, p-mTOR and FASN expression remained stable in SKTR, SKLR and SKLTR. In vitro, anti-FASN compounds plus pertuzumab showed synergistic interactions in lapatinib- and dual- resistant cells and improved the results of pertuzumab plus trastuzumab co-treatment. FASN inhibitors combined with temsirolimus displayed the strongest synergistic interactions in resistant cells. In vivo, both orthoxenopatients showed strong response to the antitumor activity of the combination of EGCG with pertuzumab or temsirolimus, without signs of toxicity. We showed that the simultaneous blockade of FASN and HER2 pathways is effective in cells and in breast cancer models refractory to anti-HER2 therapies.


Conflict of interest statement

Competing Interests: The authors have declared that no competing interests exist.

Figures

Fig 1
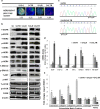
Fig 1. Characterization of parental (SK) and resistant (SKTR, SKLR and SKLTR) cells.
(a) HER2 gene copy number is maintained in resistant cells. FISH, fluorescence in situ hybridization; HER2/CEN17 > 2 indicates HER2 gene amplification. (b) Resistant cells showed changes in the expression and activation of EGF family receptors but maintained downstream pathways activation (ERK1/2/AKT/mTOR) without affecting FASN protein expression levels. Protein expression and activation of EGFR family receptors pathways was analyzed by Western Blot. Gels shown are representative of those obtained from 3 independent experiments. (c) Mutational status of PIK3CA gene in resistant cells. Trastuzumab-resistant cells (SKTR) acquire the activating PIK3CA_E545K mutation and lapatinib- and lapatinib plus trastuzumab-resistant cells (SKLR and SKLTR) acquire the activating PIK3CA_E542K mutation. DNA sequencing of PI3K exon 9 of the resistant cells compared with the parental cells. (d) EGFR ligands are increased in resistant cells. Changes in the expression of each ligand by acquisition of resistance were assessed by real-time PCR and values were normalized against the corresponding mRNA expression of TBP constitutive gene. Then, ligands expression of trastuzumab-, lapatinib- and trastuzumab plus lapatinib-resistant cells (SKTR, SKLR, SKLTR) was compared to parental cells (SK). The bars indicate the mean fold change ± SE of two independent quantifications. Bars over the dotted line indicate an increase in the gene expression compared to the control cells, while bars under the dotted line represent impaired gene expression after the treatment. (e) Cellular adhesion and invasion capacity are increased in resistant cells. Fold-changes of resistant cells (SKTR, SKLR and SKLTR) respect to wild type SKBr3 cells (SK) in adhering to extracellular matrix proteins or in invasion capacity. Fold changes were assessed with adhesion or invasion kit assays. Experiments were performed at least twice. * (p ≤ 0.05) and ** (p ≤ 0.01) indicate levels of statistically significant difference compared with parental cells.
Fig 2
Fig 2. Pertuzumab plus trastuzumab combination improves effects in SK and SKLTR.
Cells were treated with trastuzumab (20 μM), pertuzumab (5 μg/ml) and the combination of both for 5 days. Results were determined using an MTT assay and are expressed as the percentage of cell proliferation inhibition from three independent experiments performed in triplicate. Columns represent % of cell proliferation inhibition after trastuzumab or pertuzumab exposure and bars SE. * (p ≤ 0.05), ** (p ≤ 0.01) and *** (p ≤ 0.001) indicate levels of statistically significant difference compared with effect of the same drug in SKBr3 cells or compared with drugs administered alone (dashed line).
Fig 3
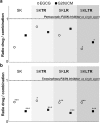
Fig 3. FASN inhibitors improve pertuzumab and temsirolimus activity in parental and resistant cells.
(a) Cells were treated with pertuzumab (5 μg/ml) combined with EGCG (60 μM) or G28UCM (5 μM) for 5 days. Results were determined using an MTT assay and are expressed as ratio of inhibition of cell proliferation induced for each treatment alone versus inhibition induced for co- treatment from three independent experiments performed in triplicate. Dashed lines represent the effect of each drug alone, ratio 1. (b) Cells were treated with temsirolimus (0.05, 0.1, 0.5 and 1 μM) combined with EGCG (60 μM) or G28UCM (5 μM) for 2 days. Results were determined using an MTT assay and are expressed as ratio of inhibition of cell proliferation induced for each treatment alone versus inhibition induced for co- treatment from three independent experiments performed in triplicate and with several temsirolimus concentrations. Dashed lines represent the effect of each drug alone, ratio 1. * (p ≤ 0.05), ** (p ≤ 0.01) and *** (p ≤ 0.001) indicate levels of statistically significant difference compared with drugs administered alone.
Fig 4
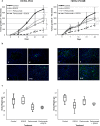
Fig 4. EGCG, alone or combined with pertuzumab, inhibits tumor growth of sensitive and resistant HER2+ orthoxenopatients.
(a) Mice bearing HER2-PDX and resistant HER2-PDX (HER2-PDXR) were treated with control (C), EGCG (30 mg/kg, 3 days a week), pertuzumab (30 mg/kg, 1 day a week) or the combination (EGCG plus pertuzumab) for 24 days. Dots are mean of each experimental group and bars, SE. * (p ≤ 0.05), ** (p ≤ 0.01) and *** (p ≤ 0.001). (b) Apoptosis, by TUNEL fluorescent assay, was perfomed in control (C), EGCG (E), pertuzumab (P) and combination (P+E) treated as in (A) tumors. Tumors were collected at the end of the experiment and fixed in paraffin. Pictures are representative of two samples of each group. (c) Body weight of the mice treated as in (A). Data are expressed as body weight at the end of the experiment and boxes show the 25th to 75th percentiles, whereas whiskers extend to the 5th and 95th percentiles.
Fig 5
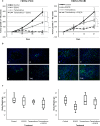
Fig 5. EGCG, alone or combined with temsirolimus, inhibits tumor growth of sensitive and resistant HER2+ orthoxenopatients.
(a) Mice bearing HER2-PDX and resistant HER2-PDX (HER2-PDXR) were treated with control (C), EGCG (30 mg/kg, 3 days a week), temsirolimus (10 mg/kg, 1 day a week) or the combination (EGCG plus temsirolimus) for 21 days. Dots are mean of each experimental group and bars, SE. * (p ≤ 0.05), ** (p ≤ 0.01) and *** (p ≤ 0.001). (b) Apoptosis, by TUNEL fluorescent assay, was perfomed in control (C), EGCG (E), temsirolimus (T) and combination (T+E) treated as in (A) tumors. Tumors were collected at the end of the experiment and fixed in formalin. Pictures are representative of two samples of each group. (c) Body weight of the mice treated as in (A). Data are expressed as body weight at the end of the experiment and boxes show the 25th to 75th percentiles, whereas whiskers extend to the 5th and 95th percentiles.

References

    1. Baselga J, Swain SM. Novel anticancer targets: revisiting ERBB2 and discovering ERBB3. Nat Rev Cancer. 2009;9(7):463–75. 10.1038/nrc2656 . - DOI - PubMed
    1. Olayioye MA, Neve RM, Lane HA, Hynes NE. The ErbB signaling network: receptor heterodimerization in development and cancer. EMBO J. 2000;19(13):3159–67. 10.1093/emboj/19.13.3159 - DOI - PMC - PubMed
    1. Ferguson KM, Berger MB, Mendrola JM, Cho HS, Leahy DJ, Lemmon MA. EGF activates its receptor by removing interactions that autoinhibit ectodomain dimerization. Mol Cell. 2003;11(2):507–17. . - PubMed
    1. Citri A, Yarden Y. EGF-ERBB signalling: towards the systems level. Nat Rev Mol Cell Biol. 2006;7(7):505–16. 10.1038/nrm1962 . - DOI - PubMed
    1. Zhang H, Berezov A, Wang Q, Zhang G, Drebin J, Murali R, et al. ErbB receptors: from oncogenes to targeted cancer therapies. J Clin Invest. 2007;117(8):2051–8. 10.1172/JCI32278 - DOI - PMC - PubMed

Publication types

MeSH terms