

Changing Malaria Prevalence on the Kenyan Coast since 1974: Climate, Drugs and Vector Control
- PMID: 26107772
- PMCID: PMC4479373
- DOI: 10.1371/journal.pone.0128792
Changing Malaria Prevalence on the Kenyan Coast since 1974: Climate, Drugs and Vector Control
Abstract
Background: Progress toward reducing the malaria burden in Africa has been measured, or modeled, using datasets with relatively short time-windows. These restricted temporal analyses may miss the wider context of longer-term cycles of malaria risk and hence may lead to incorrect inferences regarding the impact of intervention.
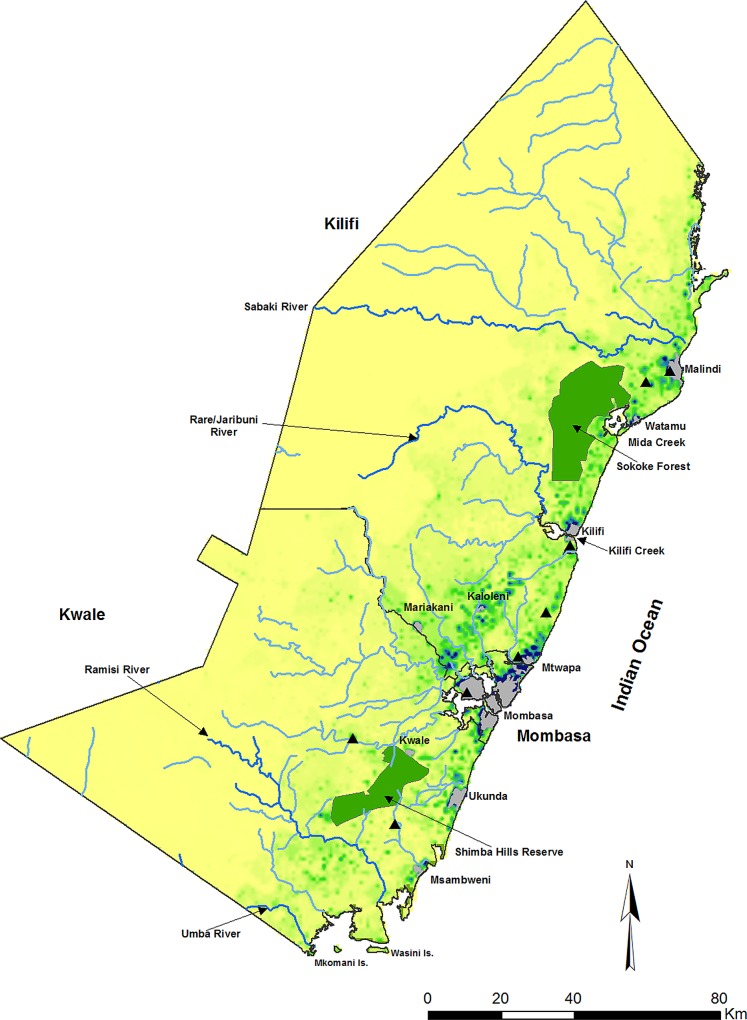
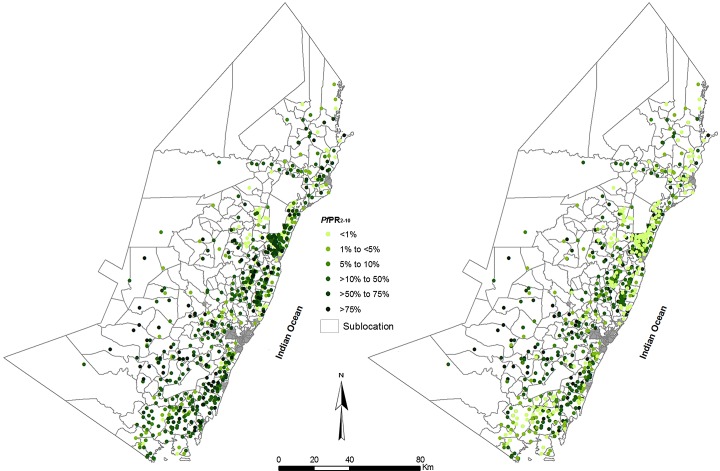
Methods: 1147 age-corrected Plasmodium falciparum parasite prevalence (PfPR2-10) surveys among rural communities along the Kenyan coast were assembled from 1974 to 2014. A Bayesian conditional autoregressive generalized linear mixed model was used to interpolate to 279 small areas for each of the 41 years since 1974. Best-fit polynomial splined curves of changing PfPR2-10 were compared to a sequence of plausible explanatory variables related to rainfall, drug resistance and insecticide-treated bed net (ITN) use.
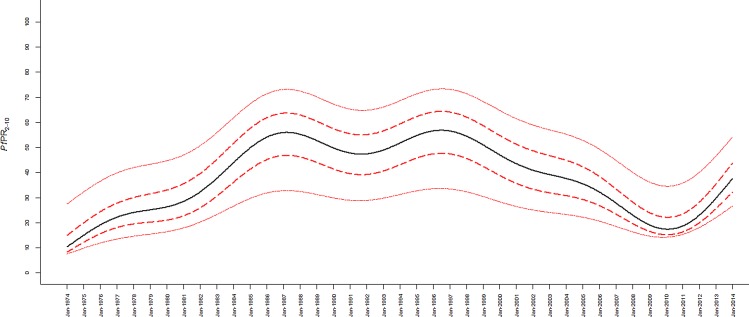
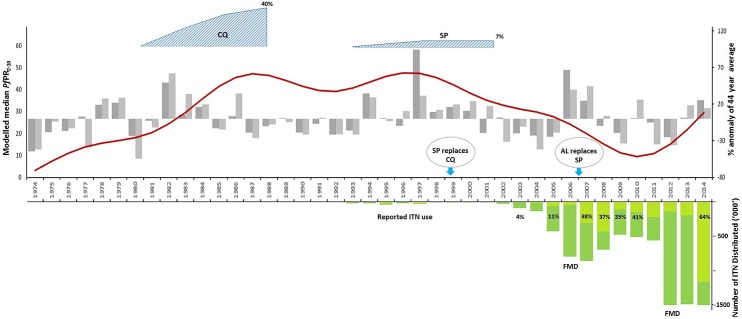
Results: P. falciparum parasite prevalence initially rose from 1974 to 1987, dipped in 1991-92 but remained high until 1998. From 1998 onwards prevalence began to decline until 2011, then began to rise through to 2014. This major decline occurred before ITNs were widely distributed and variation in rainfall coincided with some, but not all, short-term transmission cycles. Emerging resistance to chloroquine and introduction of sulfadoxine/pyrimethamine provided plausible explanations for the rise and fall of malaria transmission along the Kenyan coast.
Conclusions: Progress towards elimination might not be as predictable as we would like, where natural and extrinsic cycles of transmission confound evaluations of the effect of interventions. Deciding where a country lies on an elimination pathway requires careful empiric observation of the long-term epidemiology of malaria transmission.
Conflict of interest statement
Figures
References
-
- Nabarro D, Tayler EM. The roll back malaria campaign. Science. 1998. June 26;280(5372):2067–8 - PubMed
-
- World Health Organization. The Abuja Declaration and the Plan of Action. An Extract from the African Summit on Roll Back Malaria, Abuja, 25 April 2000; WHO/CDS/RBM/2000.17. Available: http://www.rollbackmalaria.org/docs/abuja_declaration_final.htm. Accessed 14 January 2015.
-
- World Health Organization. The World Malaria Report 2013. Available: http://www.who.int/malaria/publications/world_malaria_report_2014/en/. Accessed 14 January 2015.
MeSH terms
Substances
Grants and funding
LinkOut - more resources
Full Text Sources
Other Literature Sources
