. 2015 Jun 24;10(6):e0129518.
doi: 10.1371/journal.pone.0129518. eCollection 2015.

Foxg1-Cre Mediated Lrp2 Inactivation in the Developing Mouse Neural Retina, Ciliary and Retinal Pigment Epithelia Models Congenital High Myopia

Affiliations

Foxg1-Cre Mediated Lrp2 Inactivation in the Developing Mouse Neural Retina, Ciliary and Retinal Pigment Epithelia Models Congenital High Myopia

Olivier Cases et al. PLoS One. .

Abstract

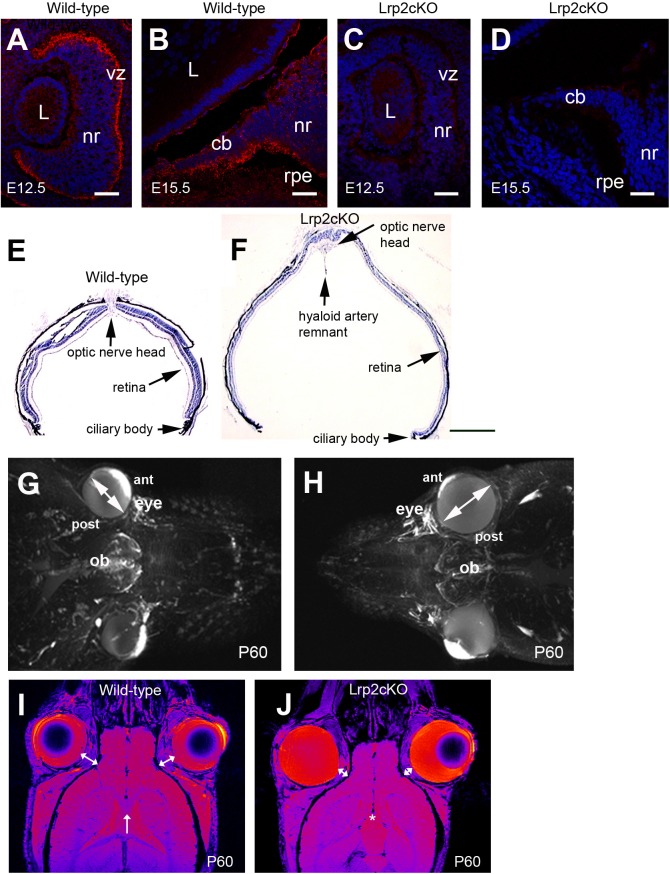
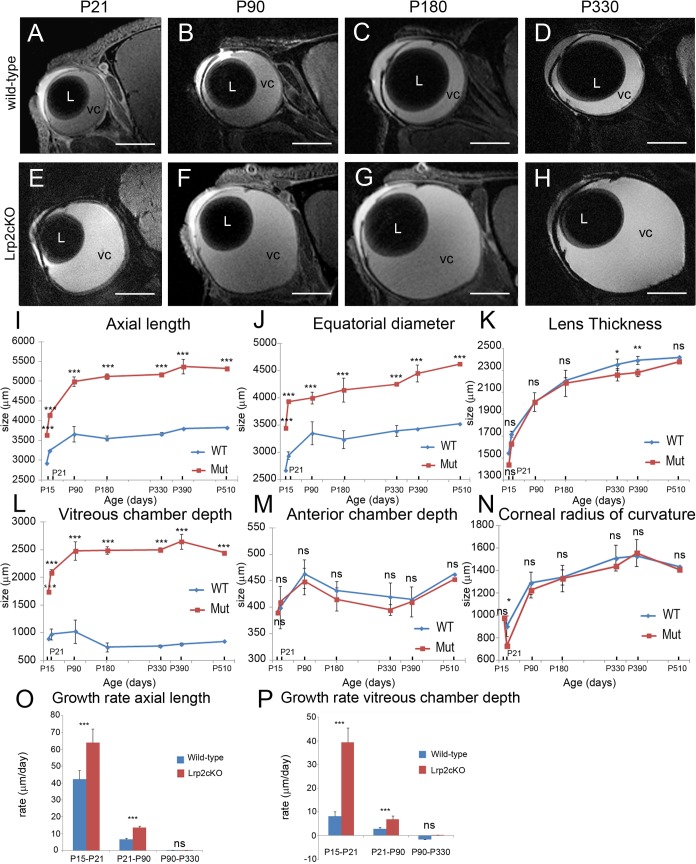
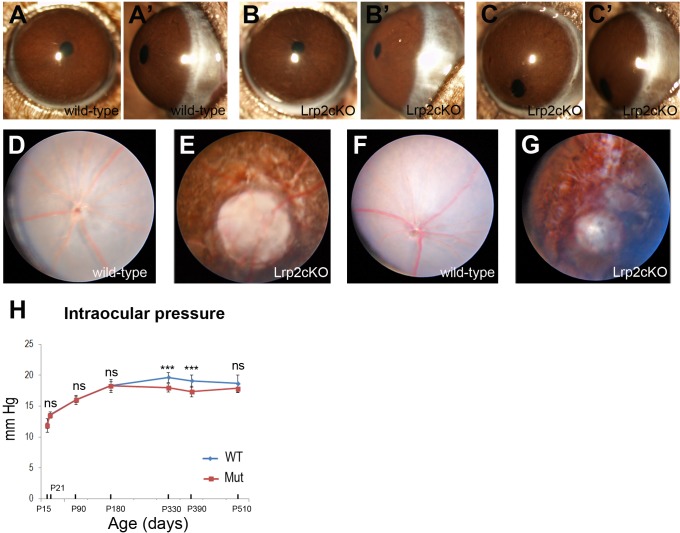
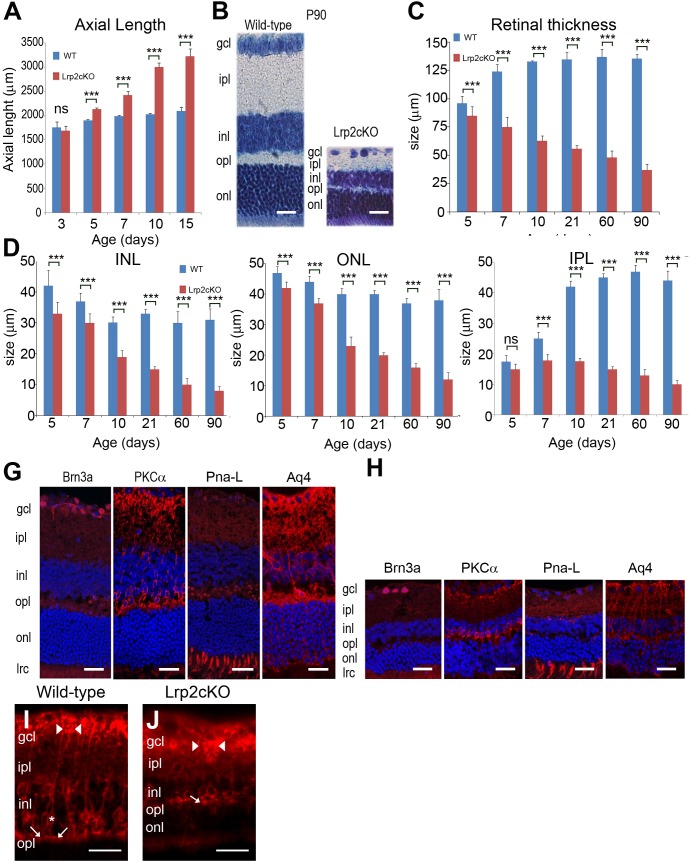
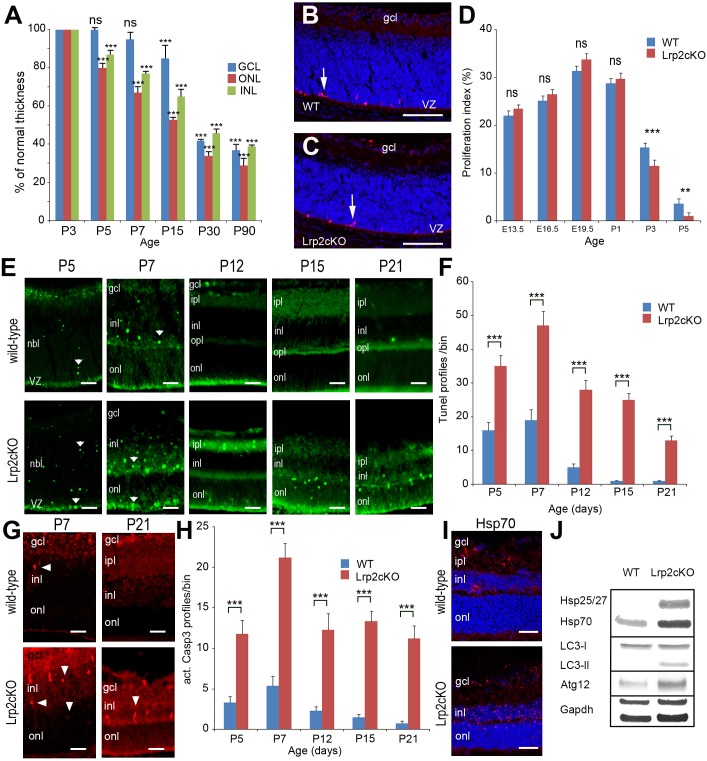
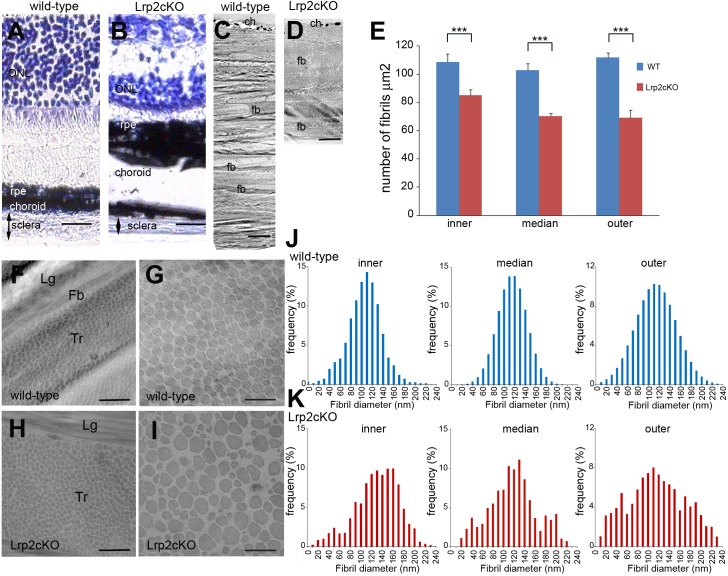
Myopia is a common ocular disorder generally due to increased axial length of the eye-globe. Its extreme form high myopia (HM) is a multifactorial disease leading to retinal and scleral damage, visual impairment or loss and is an important health issue. Mutations in the endocytic receptor LRP2 gene result in Donnai-Barrow (DBS) and Stickler syndromes, both characterized by HM. To clearly establish the link between Lrp2 and congenital HM we inactivated Lrp2 in the mouse forebrain including the neural retina and the retinal and ciliary pigment epithelia. High resolution in vivo MRI imaging and ophthalmological analyses showed that the adult Lrp2-deficient eyes were 40% longer than the control ones mainly due to an excessive elongation of the vitreal chamber. They had an apparently normal intraocular pressure and developed chorioretinal atrophy and posterior scleral staphyloma features reminiscent of human myopic retinopathy. Immunomorphological and ultrastructural analyses showed that increased eye lengthening was first observed by post-natal day 5 (P5) and that it was accompanied by a rapid decrease of the bipolar, photoreceptor and retinal ganglion cells, and eventually the optic nerve axons. It was followed by scleral thinning and collagen fiber disorganization, essentially in the posterior pole. We conclude that the function of LRP2 in the ocular tissues is necessary for normal eye growth and that the Lrp2-deficient eyes provide a unique tool to further study human HM.


Conflict of interest statement

Competing Interests: TD is an employee of Sanofi, whose company partly funded this study. There are no patents, products in development or marketed products to declare. This does not alter the authors' adherence to all the PLOS ONE policies on sharing data and materials.

Figures

Fig 1
Fig 1. Lrp2-deficient eyes are abnormally enlarged.
Sagittal cryosections through the developing eye (A-D). Lrp2 is expressed in the developing neuroretina (nr) at E12.5 (A). From E15.5 onward the signal is restricted in the lens (L) facing inner layer of the ciliary body (cb) epithelium, a low expression is also seen in the outer layer of the CB and in the retinal pigmented epithelium (rpe) (B). Loss of Lrp2 signal in Lrp2 FoxG1.cre-KO mutants at E12.5 and E15.5 (C, D). Sagittal cryosections of control and mutant retinas at P60 showing retinal thinning and the presence of a posterior staphyloma in the mutant (E, F). Reconstruction of the mouse face using MRI at P60 (G, H). The Lrp2 FoxG1.cre-KO mutants display bilateral eye enlargement, through the anterior-posterior axis and the equatorial diameter (double headed arrows in G, H). Horizontal MRI images showed that the retrobulbar space, between the orbit and the eyeball, (double-headed arrows in I, J) is decreased in Lrp2 FoxG1.cre-KO mutants. The corpus callosum (arrow in I) is not formed in the mutants (asterisk in J). (vz) ventricular zone. Scale bars: 25 μm in A-D; 600 μm in E, F.
Fig 2
Fig 2. MRI analysis of post-natal eye growth in control and Lrp2 FoxG1.cre-KO mutants over the first year of life.
High resolution sagittal slices through the optical axis of the right eye of each mouse were acquired (A-H). A variety of optical parameters were extracted from the MRI images collected from groups of control and mutant mice at the ages indicated (I-N). Growth rate of axial length and vitreous chamber depth (O, P). A two-way ANOVA post hoc Tukey test was used, P<0.05, **P<0.01, ***P<0.001, ns: not statistically significant, values are mean ± SEM of 4 animals per age and genotype. Scale bars: 1500 μm in A-H.
Fig 3
Fig 3. Opthalmological evaluation of control and mutant mice.
Similar gross morphology of the anterior segment in control (A, A’) and Lrp2 FoxG1.cre-KO mutant littermates at P90 (B, B’). In some cases pupillary ectopia was observed in the mutants (C, C’). Fundus photographs of control (D, F) and mutant eyes (E, G) at P60 (D, E) and P180 (F, G) respectively show chorioretinal atrophy and peripapillary staphyloma. (H) Comparisons of intraocular pressure between control and mutant littermates at the indicated postnatal ages. Two-way ANOVA post hoc Tukey test was used, ***P<0.001, ns: not statistically significant, values are mean ± SEM of 10 animals per age and genotype.
Fig 4
Fig 4. Histological and immunomorphological analysis of post-natal eye growth.
Significantly increased axial length is first observed at P5 (A). The retinal lamination in P90 Lrp2 FoxG1.cre-KO mutant eyes is normal but all the retinal cell layers appear reduced; Nissl staining (B). The continuous reduction of the retinal thickness between P5 and P90 (C) is mainly due to the thinning of the inner nuclear (INL), outer nuclear (ONL) and inner plexiform (IPL) cell layers (D-F). The distribution of the typical retinal markers Brn3a, PKCalpha, PNA-Lectin (PNA-L) and Aquaporin 4 (Aq4) in the retinal ganglion, bipolar, photoreceptor and Müller cells respectively is similar in control (G) and mutant littermates (H). The number of PKCalpha, PNA-L and Aq4 positive cells appears decreased in the mutants. (I) PKCalpha immunoreactivity in bipolar cells shows a tight cluster of dendrites (arrow) in the OPL, an oval cell body (asterisk) in the INL, and a vertically directed axon, which expands into clusters of terminals (arrowheads) in the proximal portion of the IPL and GCL. (J) In the Lrp2 FoxG1.cre-KO mutant the PKCalpha positive bipolar cell has shrunk dendrites at the OPL-INL border (arrow) and a vertically directed axon, which expands abnormally in thick clusters (arrowheads) in the IPL and GCL. Two-way ANOVA post hoc Tukey test was used, **P<0.01, ***P<0.001, values are mean ± SEM of 10 animals per age and genotype. Scale bars: 50 μm in B, G, H; 70 μm in I, J.
Fig 5
Fig 5. Decreased retinal cell density is associated with increased cell death in Lrp2 FoxG1.cre-KO mutant eyes.
Reduced retinal cell density in the ONL, INL and GCL between P5 and P90. Values are expressed in % of normal thickness of the corresponding layers. Comparisons were calculated between P3 as 100% cell density and the other time points in each layer. Two-way ANOVA post hoc Tukey was used, ***P<0.001, ns: non statistically significant, n = 5 animals per age. (A). The PH3 + cells are similarly distributed in control (B) and mutant retinal layers at P3 (C). Similar proliferation indexes in control and mutant retinas between E13.5 and P1, a significant reduction is seen in the mutants at P3 and P5 (D). In normal retinas TUNEL + cells are essentially seen in the INL and to a lesser extent in the ONL and GCL layers (E, upper panel). In the mutants the TUNEL signal appears stronger in the INL, ONL and IPL (E, lower panel). Cell death is significantly increased in the mutants between P5 and P21 (F). Distribution of caspase 3+ apoptotic cells in control and mutant retinas at P7 and P21 (G). Apoptosis is significantly increased in the mutants (H). The expression of the marker of autophagy Hsp70 is particularly strong in the mutant INL (I). Western-blot analysis of the indicated autophagic markers; GAPDH is used as an internal loading control (J). Two-way ANOVA post hoc Tukey test was used, **P<0.01, ***P<0.001, ns: not statistically significant, values are mean ± SEM of 5 animals per age and genotype; ***p<0.01. Scale bars: 50 μm in B, C, I; 30 μm in E, G.
Fig 6
Fig 6. Scleral modifications in Lrp2 FoxG1.cre-KO mutant eyes.
Nissl staining of retinal sections in control (A) and mutant (B) eyes shows reduced scleral thickness at P90. The choroid and occasionally the RPE appear thicker at the posterior pole of the mutant eyes. Transmission electron micrographs of the posterior sclera wall (C, D) shows that the collagen fibrils form well-organized lamellae in the control sclera (C); in the mutant fibril-poor areas and impaired packing are evident (D). Contrary to the control sclera the collagen fibril density is lower in all layers of the mutant sclera (E). Transmission electron micrographs showed fibril collagen organization within a lamella of the posterior sclera (F, H) and in localized areas (G, I) of control (F, G) and mutant (H, I). Fibrils were morphologically abnormal with irregular contours and heterogeneous diameters in the mutants. Measurements of cross-sectional diameters of fibrils from the inner, middle and outer posterior sclera in control (J) and mutant eyes (K). The mean fibril diameter distribution is modified in the mutants in all three layers; the frequency of very small as well large diameter fibrils is increased. (ch) choroid, (fb) fibroblast, (Lg) longitudinal and (Tr) transversal orientation of the cross-sectioned fibrils. Two-tailed unpaired t test was used. ***P<0.001, Values are mean ± SEM of 3 animals per genotype; see methods. Scale bars: 50 μm in A, B; 3.5 μm in C, D; 1.2 μm in F, H; 300 nm in G, I.

References

    1. Silva R. Myopic maculopathy: a review. Ophthalmol J Int Ophtalmol Int J Ophthalmol Z Für Augenheilkd. 2012;228: 197–213. 10.1159/000339893 - DOI - PubMed
    1. Morgan IG, Ohno-Matsui K, Saw S- M. Myopia. Lancet. 2012;379: 1739–1748. 10.1016/S0140-6736(12)60272-4 - DOI - PubMed
    1. Fredrick DR. Myopia. BMJ. 2002;324: 1195–1199. - PMC - PubMed
    1. Zejmo M, Formińska-Kapuścik M, Pieczara E, Filipek E, Mrukwa-Kominek E, Samochowiec-Donocik E, et al. Etiopathogenesis and management of high-degree myopia. Part I. Med Sci Monit Int Med J Exp Clin Res. 2009;15: RA199–202. - PubMed
    1. Flitcroft DI. Is myopia a failure of homeostasis? Exp Eye Res. 2013;114: 16–24. 10.1016/j.exer.2013.02.008 - DOI - PubMed

Publication types

MeSH terms

Substances