. 2015 Jun 25:6:7464.
doi: 10.1038/ncomms8464.

IL-1 receptor antagonist-deficient mice develop autoimmune arthritis due to intrinsic activation of IL-17-producing CCR2(+)Vγ6(+)γδ T cells

Affiliations

IL-1 receptor antagonist-deficient mice develop autoimmune arthritis due to intrinsic activation of IL-17-producing CCR2(+)Vγ6(+)γδ T cells

Aoi Akitsu et al. Nat Commun. .

Abstract

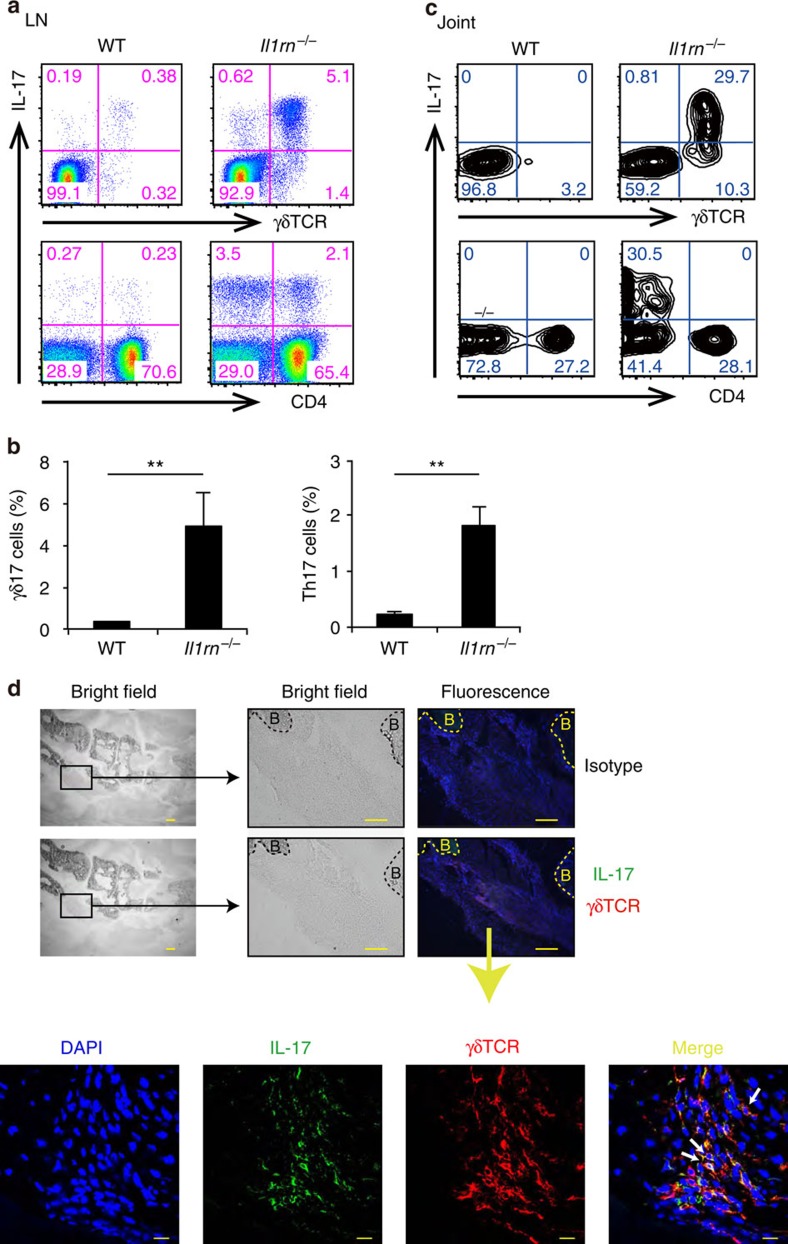
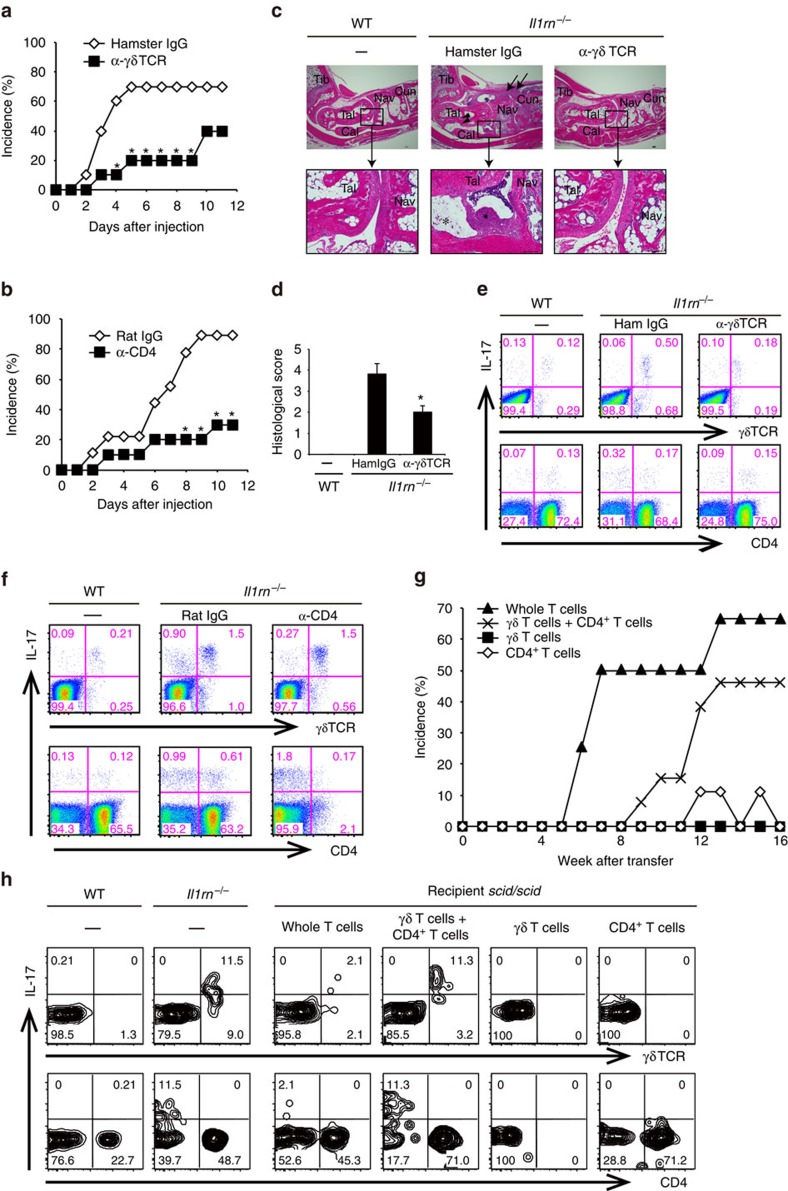
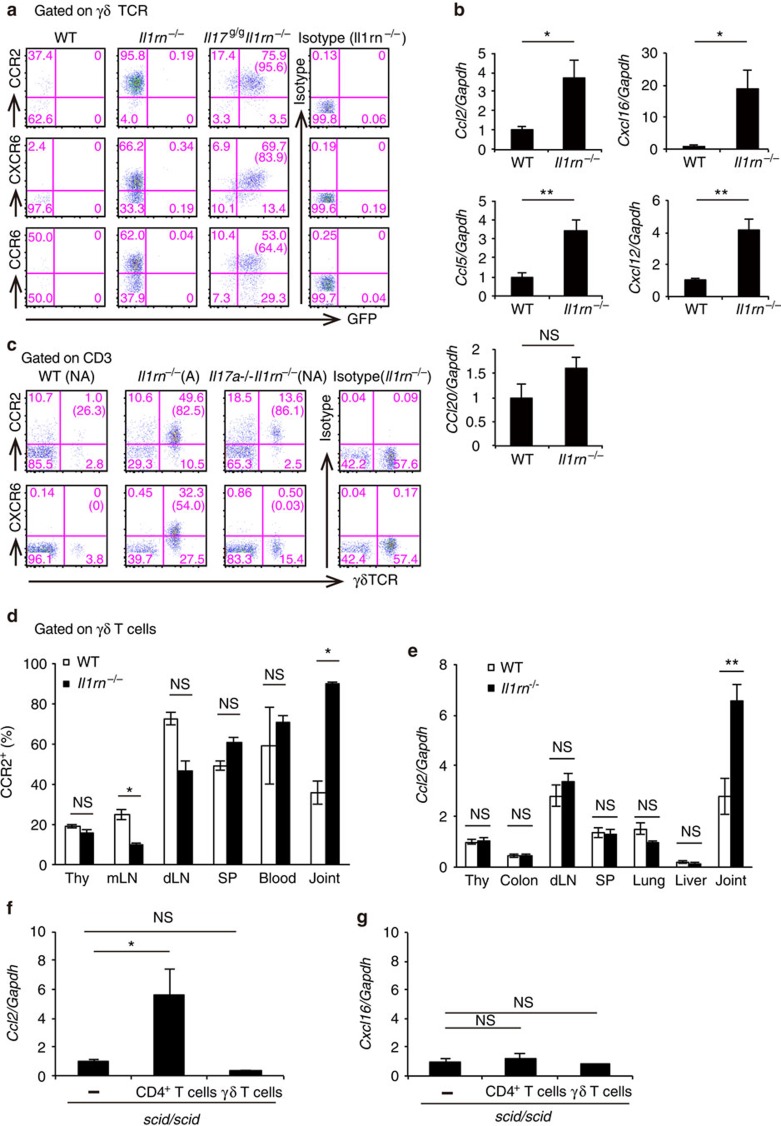
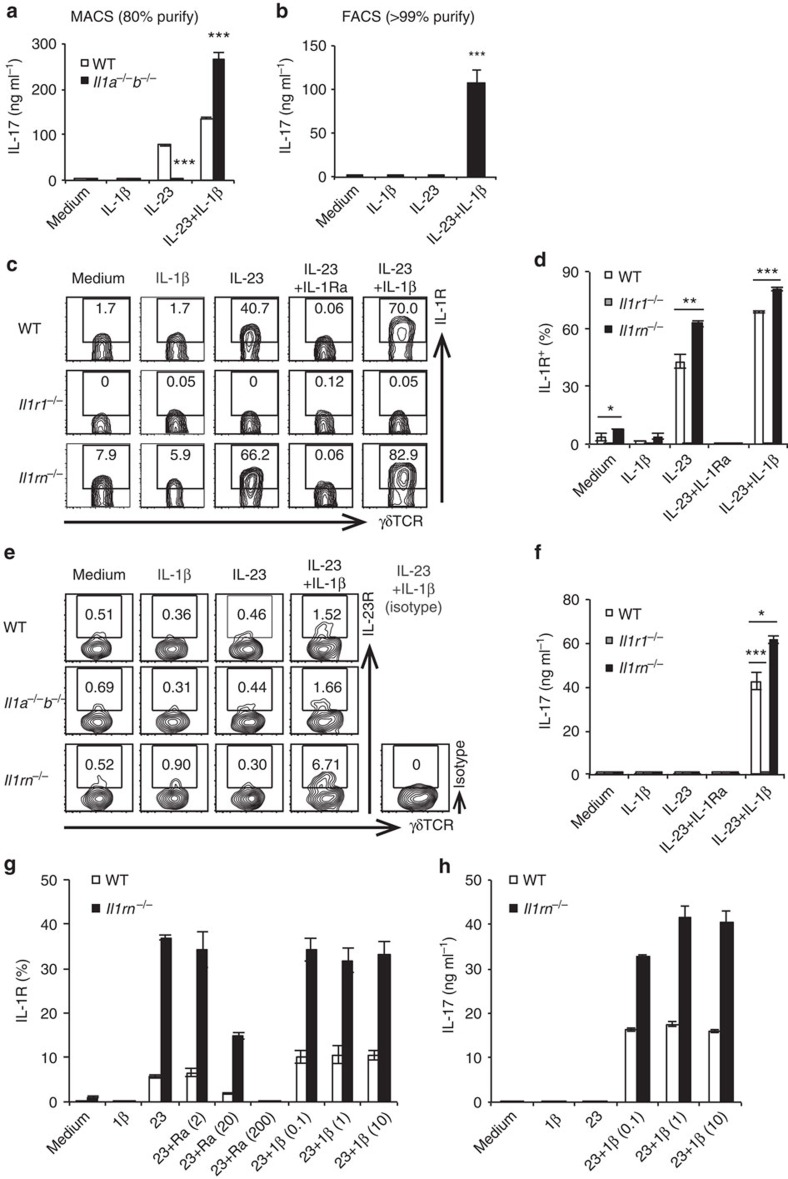
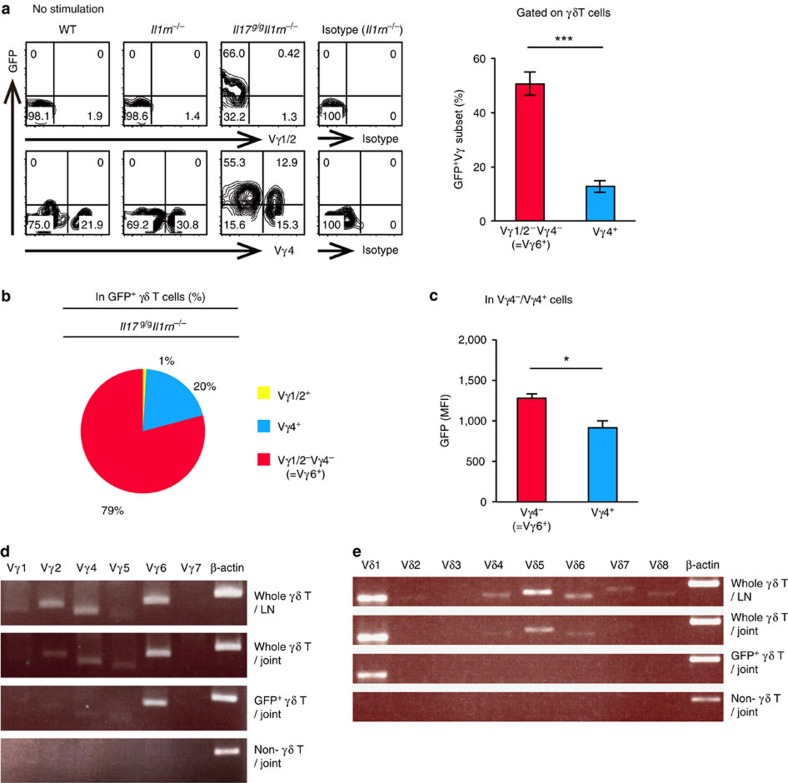
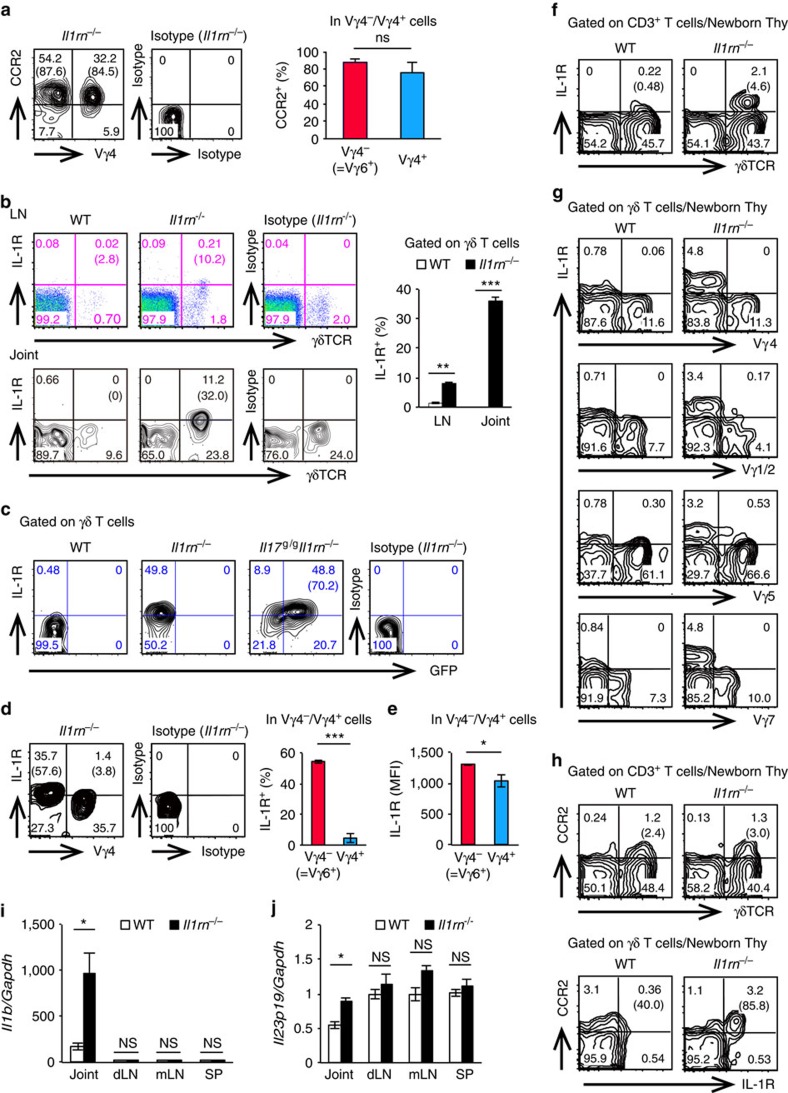
Interleukin-17 (IL-17)-producing γδ T (γδ17) cells have been implicated in inflammatory diseases, but the underlying pathogenic mechanisms remain unclear. Here, we show that both CD4(+) and γδ17 cells are required for the development of autoimmune arthritis in IL-1 receptor antagonist (IL-1Ra)-deficient mice. Specifically, activated CD4(+) T cells direct γδ T-cell infiltration by inducing CCL2 expression in joints. Furthermore, IL-17 reporter mice reveal that the Vγ6(+) subset of CCR2(+) γδ T cells preferentially produces IL-17 in inflamed joints. Importantly, because IL-1Ra normally suppresses IL-1R expression on γδ T cells, IL-1Ra-deficient mice exhibit elevated IL-1R expression on Vγ6(+) cells, which play a critical role in inducing them to produce IL-17. Our findings demonstrate a pathogenic mechanism in which adaptive and innate immunity induce an autoimmune disease in a coordinated manner.


Figures

Figure 1
Figure 1. γδ T cells are the main source of IL-17 in the inflamed joints of Il1rn−/− mice.
(a–c) Flow cytometry of LN cells from WT (n=3) and arthritic Il1rn−/− mice (n=3) (a) or joint-infiltrating cells from WT (pool of five mice) and arthritic Il1rn−/− mice (pool of two mice) (c). All cells were stimulated with P/I for 5 h, and then stained for intracellular IL-17. Numbers refer to percent cells in CD3ɛ+ cells. Quantification of IL-17+ γδ TCR+ and IL-17+ CD4+ in CD3ɛ+ cells are shown (b). **P<0.01 versus WT mice (unpaired Student's t-test). Data show mean±s.e.m. (d) Frozen sections of arthritic joints of Il1rn−/− mice were co-stained with anti-IL-17 Ab (green), anti-γδ TCR Ab (red) and 4,6-diamidino-2-phenylindole (DAPI) (blue). Sections were observed under a fluorescence microscope (top and middle panels, scale bars, 100 μm), and a confocal microscope (bottom panels, scale bars, 10 μm). B, bone. IL-17+ γδ TCR+ cells are shown by white arrows. Similar results were obtained in six other Il1rn−/− mice. All data except d are representative of >5 independent experiments.
Figure 2
Figure 2. Collaboration between CD4+ T cells and γδ17 cells is important for the development of arthritis.
(a,b) Suppression of arthritis development in Il1rn−/− mice after treatment with anti-γδ TCR (a) or anti-CD4 (b) mAb. Non-arthritic Il1rn−/− mice at the age of 4 weeks were injected on days 0, 3, 7 and 10 (ages of 28, 31, 35 and 38 days) with anti-γδ TCR mAb (▪, n=10) or isotype-matched hamster IgG (◇, n=10) (a), or with anti-CD4 mAb (▪, n=10) or isotype-matched rat IgG (◇, n=9) (b). *P<0.05 versus control IgG, assessed by the χ2-test. (c,d) Non-arthritic Il1rn−/− mice at the age of 20 days were injected with anti-γδ TCR mAb or hamster IgG every 3 days (ages of 20, 23 and 26 days), and mice were killed at the age of 27 days. Representative haematoxylin and eosin-stained sections of ankle joints in non-treated WT mouse (left column, n=6) and Il1rn−/− mouse treated with control hamster IgG (middle column, n=6) or α-γδ TCR mAb (right column, n=5) are shown. Synovial cell proliferation and inflammatory cell infiltration (arrows), bone erosion (arrowheads), fibrin clots (*) and pannus formation (★) in control Il1rn−/− mouse (middle column) are indicated. Scale bars, 100 μm. Tib, tibia; Tal, talus; Cal, calcaneum; Nav, navicular bone; Cun, cuneiform bone (c). (d) The means of histological scores are shown. *P<0.05 versus Il1rn−/− mice treated with hamster IgG. (e,f) Flow cytometry of LN cells from antibody-treated Il1rn−/− mice. Cells were collected from Il1rn−/− mice, 8 days after the first injection with anti-γδ TCR mAb or hamster IgG-treated (e) or 11 days after the first treatment with anti-CD4 mAb or rat IgG (f) or from non-treated WT mice. Cells were stimulated with P/I for 5 h, and then stained for intracellular IL-17. Numbers refer to percentages in CD3ɛ+ cells. (a–f) Data are representative of two independent experiments. (g,h) scid/scid mice at the age of 4 weeks were transferred with γδ T cells from Cd4−/−Il1rn−/− mice (▪, n=8), CD4+ T cells from Tcrd−/−Il1rn−/− mice (◇, n=9), Thy1.2+ T cells (whole-T cells) from Il1rn−/− mice (▪, n=8) or γδ T cells from Cd4−/−Il1rn−/− mice plus CD4+ T cells from Tcrd−/−Il1rn−/− mice (× , n=13). Incidence of arthritis is shown (g). Flow cytometry of the joint-infiltrating cells of scid/scid mice after 18 weeks of transfer, or age-matched and non-treated WT or Il1rn−/− mice (h). Cells were stimulated with P/I for 5 h, and then stained for intracellular IL-17. Numbers refer to percentage in CD3ɛ+ cells. Data are pooled from g or representative of (h) two independent experiments.
Figure 3
Figure 3. CCR2+ γδ17 cells predominantly accumulate in Il1rn−/− mouse joints.
(a) Expression of chemokine receptors and GFP on joint-infiltrating cells from WT (n=3, pool of two mice each), Il1rn−/− (n=3) and Il17g/gIl1rn−/− (n=3) mice at 16 weeks of age. Numbers represent percentages in CD3ɛ+ γδ TCR+ cells. Numbers in parentheses represent percentages in GFP+ CD3ɛ+ γδ TCR+ cells. (b) Quantitative PCR (qPCR) analysis of the transcripts of CCL2 (Ccl2), CXCL16 (Cxcl16), CCL20 (Ccl20), CCL5 (Ccl5) and CXCL12 (Cxcl12) in joints of WT (n=4) or Il1rn−/− (n=4) mice. Values are shown relative to those in WT mice. *P<0.05; **P<0.01; NS, not significant (versus WT mice) (unpaired Student's t-test). (c) Flow cytometry of the joint-infiltrating γδ T cells from WT, arthritic Il1rn−/− and non-arthritic Il17a−/−Il1rn−/− mice. Numbers represent percentages in CD3ɛ+ cells. Numbers in parentheses represent percentages in CD3ɛ+ γδ TCR+ cells. (d) Contents of CCR2+ cells in CD3ɛ+ γδ TCR+ cells in the thymus (Thy), mesenteric LNs (mLN), draining LNs (dLN), spleens (SP), blood and joints of WT (n=3) and Il1rn−/− (n=3) mice at the age of 14 weeks. *P<0.05; NS (versus WT mice) (unpaired Student's t-test). (e) Levels of CCL2 mRNA in whole tissue were measured by qPCR in various tissues from WT (n=5) and Il1rn−/− (n=5) mice at the age of 8 weeks. Values are shown relative to those in WT mouse thymus total RNA. **P<0.01; NS (versus WT mice) (unpaired Student's t-test). (f,g) qPCR analysis of mRNA for CCL2 (f) and CXCL16 (g) in joints of scid/scid mice after 24 weeks of transfer of CD4+ T cells (n=4) or γδ T cells (n=3), or age-matched scid/scid mice (n=3). Values are shown relative to those in control scid/scid mice. *P<0.05; NS versus control scid/scid mice (unpaired Student's t-test). mRNA expression was normalized to that of Gapdh (b,e–g). All data except a and c show mean±s.e.m. Data are representative of two (c–g) or >3 (a,b) independent experiments.
Figure 4
Figure 4. CCL2 is essential for γδ T-cell infiltration into joints and arthritis development.
(a) Incidence (left) and severity scores of arthritis in affected mice (right) in Il17g/gIl1rn−/− mice after anti-CCL2 mAb treatment. Non-arthritic Il17g/gIl1rn−/− mice at the age of 21 days were injected with anti-CCL2 mAb (▪, n=9) or PBS (◇, n=11) every 3 days (ages of 21, 24, 27 and 30 days). *P<0.05 versus treatment with PBS, assessed by the χ2-test. Data represent a pool of two independent experiments. (b–j) Flow cytometry of joint-infiltrating cells from Il17g/gIl1rn−/− mice 11 days after the first injection. Cells were collected from PBS-treated arthritic (A) mice (n=5) and anti-CCL2 mAb-treated non-arthritic (NA) (n=3) or arthritic (A) (n=2) mice. Age-matched and non-treated WT (n=3) and arthritic Il1rn−/− (n=3) mice were used as controls. Numbers refer to percentage in CD3ɛ+ cells (b), in CD3ɛ+ γδ TCR+ cells (d) or in GFP+CD3ɛ+γδ TCR+ cells (g,i). The average proportions of γδ T cells in CD3ɛ+ cells (c), CCR2+ (e) or GFP+ (f) cells among γδ TCR+ cells, or CCR2+ (h) or CXCR6+ (j) cells among GFP+γδ TCR+ cells, are shown. *P<0.05; ***P<0.001; NS, not significant (versus Il17g/gIl1rn−/− mice treated with PBS) (unpaired Student's t-test). Data show mean±s.e.m. Data (b–j) are representative of two independent experiments.
Figure 5
Figure 5. IL-23 induces expression of IL-1R on the surface of γδ T cells, whereas IL-1Ra suppresses its expression.
(a,b) Concentrations of IL-17 in culture supernatants of magnetic-activated cell sorting (MACS)-purified (about 80%) (a) or FACS-purified (>99% pure) (b) splenic γδ T cells from pools of 16 WT mice (a,b) or 16 Il1a−/−b−/− mice (b) stimulated for 3 days with medium only, IL-1β, IL-23 or IL-23 plus IL-1β, without γδ TCR stimulation. IL-17 was detected by enzyme-linked immunosorbent assay (ELISA). ***P<0.001 versus WT mice (a); ***P<0.001 versus medium only (b) (unpaired Student's t-test). (c–h) FACS-purified γδ T cells from pooled spleens of WT, Il1r1−/−, Il1a−/−b−/− or Il1rn−/− mice (11–16 mice each) were stimulated for 3 days with medium only, IL-1β, IL-23, IL-23 plus IL-1β or IL-23 plus IL-Ra. Flow cytometry of γδ T cells stained for surface IL-1R (c) and IL-23R (e) are shown. Quantification of IL-1R+ γδ T cells is indicated in d and g. Concentrations of IL-17 in culture supernatants were determined by ELISA (f,h). *P<0.05; **P<0.01; ***P<0.001 (versus WT mice) (unpaired Student's t-test). Numbers in parentheses indicate the concentration of cytokines (ng ml−1). Representative data (c,e) and mean±s.e.m. (a,b,d,f,g,h) of triplicate cultures are shown. All data are representative of two or three independent experiments.
Figure 6
Figure 6. The Vγ6+ γδ T-cell subset is the major source of IL-17 in Il1rn−/− mouse joints.
(a–c) GFP expression in joint-infiltrating γδ T cells from WT, Il1rn−/− and Il17g/gIl1rn−/− mice at 16 weeks of age. Numbers refer to percentage in CD3ɛ+ γδ TCR+ cells (a, left). Quantification of GFP+ Vγ subsets in CD3ɛ+ γδTCR+ cells is shown (a, right). Numbers in the pie chart show the percentages of the indicated Vγ subset among GFP+ γδ TCR+ CD3ɛ+ cells, and represent the average of three mice (b). Mean fluorescence intensity of GFP in Vγ6+ (Vγ4) or Vγ4+ cells is shown in c. *P<0.05, ***P<0.001 (versus Vγ4+ cells) (unpaired Student's t-test). Data show the mean±s.e.m. of three mice. (d,e) Vγ (d) and Vδ (e) gene expression in γδ T cells. CD3ɛ+ γδ TCR+ (whole γδ T) cells from LNs (first row) or from joints (second row) of Il1rn−/− mice and GFP+ CD3ɛ+ γδ TCR+ (GFP+ γδ T) (third row) or CD3ɛ+ γδ TCR (non-γδ T) (fourth row) cells from joints of Il17g/gIl1rn−/− mice, were sorted on a FACSAria, and Vγ and Vδ gene expression was analysed by RT–PCR.
Figure 7
Figure 7. IL-17-producing Il1rn−/− Vγ6+ γδ T cells intrinsically express high levels of IL-1R.
(a) Flow cytometry of joint-infiltrating cells from Il1rn−/− mice (n=3) for the expression of CCR2 and Vγ4. Numbers refer to percentage in CD3ɛ+ γδ TCR+ cells. Numbers in parentheses represent percentage in Vγ6+ (Vγ4) or Vγ4+ cells (left). Quantification of CCR2+ cells in Vγ6+ (Vγ4) or Vγ4+ cells is shown (right). NS, not significant versus Vγ4+ cells (unpaired Student's t-test). (b) Flow cytometry of IL-1R expression in LNs and joint-infiltrating cells from WT or Il1rn−/− mice. Numbers refer to percentages in CD3ɛ+ cells. Numbers in parenthesis represent percentages in CD3ɛ+ γδ TCR+ cells (left). The percentage of IL-1R+ cells among CD3ɛ+ γδ TCR+ cells is indicated on the right. **P<0.01; ***P<0.001 (versus WT mice) (unpaired Student's t-test). (c) FACS analysis of IL-1R and GFP expression on joint-infiltrating CD3ɛ+ γδ TCR+ cells from WT, Il1rn−/− and Il17g/g Il1rn−/− mice. Numbers in parentheses represent percentage in GFP+ γδ TCR+ cells. (d,e) Flow cytometry of IL-1R expression in joint-infiltrating cells from Il1rn−/− mice. Numbers refer to percentages in CD3ɛ+ γδ TCR+ cells. Numbers in parentheses represent percentages in Vγ6+ (Vγ4) or Vγ4+ cells (d, left). Quantification of IL-1R+ cells (d, right) and mean fluorescence intensity of IL-1R in Vγ6+ or Vγ4+ cells are indicated (e). *P<0.05; ***P<0.001 (versus Vγ4+cells) (unpaired Student's t-test). (f–h) Flow cytometry of IL-1R expression in γδ T cells in newborn thymus (within the first day after birth) from WT and Il1rn−/− mice. IL-1R expression on γδ T cells (f) and on different Vγ subsets (g), and CCR2 and IL-1R expression on γδ T cells (h) are shown. Numbers refer to percentage in CD3ɛ+ cells (f,h, top), or in CD3ɛ+ γδ TCR+ cells (g,h, bottom). Numbers in parentheses represent percentage in γδ TCR+ cells (f,h, top) or in IL-1R+ γδ TCR+ cells (h, bottom). (i,j) qPCR analysis of the transcripts for IL-1β (Il1b) (i) or IL-23 (Il23p19) (j) in cells from joints, draining LNs (dLN), mesenteric LNs (mLN) and spleens (SP) from WT or Il1rn−/− mice. mRNA levels were normalized against Gapdh, and values are shown relative to mLN of WT mice. *P<0.05; NS, not significant (versus WT mice) (unpaired Student's t-test). Data show mean±s.e.m. All data are representative of two or three independent experiments.

References

    1. Iwakura Y., Ishigame H., Saijo S. & Nakae S. Functional specialization of interleukin-17 family members. Immunity 34, 149–162 (2011). - PubMed
    1. Kellner H. Targeting interleukin-17 in patients with active rheumatoid arthritis: rationale and clinical potential. Ther. Adv. Musculoskelet. Dis. 5, 141–152 (2013). - PMC - PubMed
    1. Cua D. J. & Tato C. M. Innate IL-17-producing cells: the sentinels of the immune system. Nat. Rev. Immunol. 10, 479–489 (2010). - PubMed
    1. Akitsu A., Kakuta S., Saijo S. & Iwakura Y. Rag2-deficient IL-1 receptor antagonist-deficient mice are a novel colitis model in which innate lymphoid cell-derived IL-17 is involved in the pathogenesis. Exp. Anim. 63, 235–246 (2014). - PMC - PubMed
    1. Sutton C. E. et al.. Interleukin-1 and IL-23 induce innate IL-17 production from gammadelta T cells, amplifying Th17 responses and autoimmunity. Immunity 31, 331–341 (2009). - PubMed

Publication types

MeSH terms