Review
. 2016 Mar;17(2):293-308.
doi: 10.1093/bib/bbv038. Epub 2015 Jun 24.

A roadmap to multifactor dimensionality reduction methods

Review

A roadmap to multifactor dimensionality reduction methods

Damian Gola et al. Brief Bioinform. 2016 Mar.

Abstract

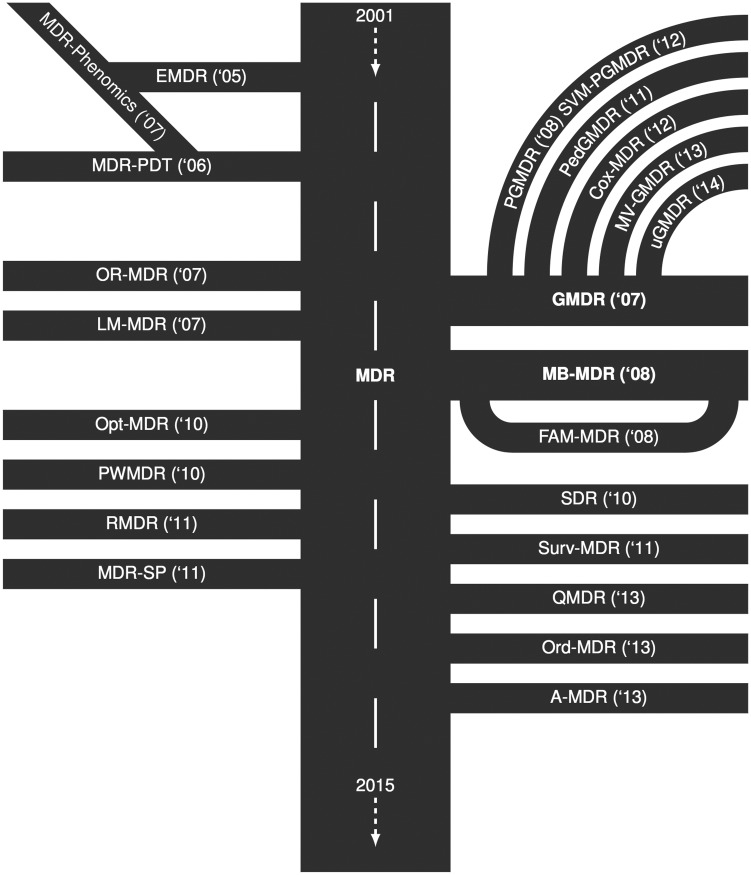
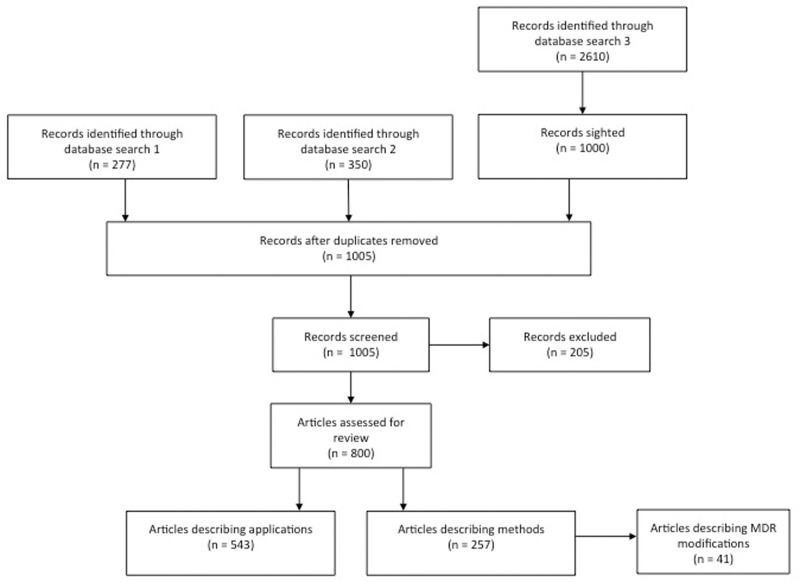
Complex diseases are defined to be determined by multiple genetic and environmental factors alone as well as in interactions. To analyze interactions in genetic data, many statistical methods have been suggested, with most of them relying on statistical regression models. Given the known limitations of classical methods, approaches from the machine-learning community have also become attractive. From this latter family, a fast-growing collection of methods emerged that are based on the Multifactor Dimensionality Reduction (MDR) approach. Since its first introduction, MDR has enjoyed great popularity in applications and has been extended and modified multiple times. Based on a literature search, we here provide a systematic and comprehensive overview of these suggested methods. The methods are described in detail, and the availability of implementations is listed. Most recent approaches offer to deal with large-scale data sets and rare variants, which is why we expect these methods to even gain in popularity.

Keywords: data mining; epistasis; interaction; machine learning; multifactor dimensionality reduction.


Figures

Figure 1.
Figure 1.
Roadmap of Multifactor Dimensionality Reduction (MDR) showing the temporal development of MDR and MDR-based approaches. Abbreviations and further explanations are provided in the text and tables.
Figure 2.
Figure 2.
Flow diagram depicting details of the literature search. Database search 1: 6 February 2014 in PubMed (www.ncbi.nlm.nih.gov/pubmed) for [(‘multifactor dimensionality reduction’ OR ‘MDR’) AND genetic AND interaction], limited to Humans; Database search 2: 7 February 2014 in PubMed (www.ncbi.nlm.nih.gov/pubmed) for [‘multifactor dimensionality reduction’ genetic], limited to Humans; Database search 3: 24 February 2014 in Google scholar (scholar.google.de/) for [‘multifactor dimensionality reduction’ genetic].
Figure 3.
Figure 3.
Overview of the original MDR algorithm as described in [2] on the left with categories of extensions or modifications on the right. The first stage is data input, and extensions to the original MDR method dealing with other phenotypes or data structures are presented in the section ‘Different phenotypes or data structures’. The second stage comprises CV and permutation loops, and approaches addressing this stage are given in section ‘Permutation and cross-validation strategies’. The following stages encompass the core algorithm (see Figure 4 for details), which classifies the multifactor combinations into risk groups, and the evaluation of this classification (see Figure 5 for details). Methods, extensions and approaches mainly addressing these stages are described in sections ‘Classification of cells into risk groups’ and ‘Evaluation of the classification result’, respectively.
Figure 4.
Figure 4.
The MDR core algorithm as described in [2]. The following steps are executed for every number of factors (d). (1) From the exhaustive list of all possible d-factor combinations select one. (2) Represent the selected factors in d-dimensional space and estimate the cases to controls ratio in the training set. (3) A cell is labeled as high risk (H) if the ratio exceeds some threshold (T) or as low risk otherwise.
Figure 5.
Figure 5.
Evaluation of cell classification as described in [2]. The accuracy of every d-model, i.e. d-factor combination, is assessed in terms of classification error (CE), cross-validation consistency (CVC) and prediction error (PE). Among all d-models the single model with lowest average CE is selected, yielding a set of best models for each d. Among these best models the one minimizing the average PE is selected as final model. To determine statistical significance, the observed CVC is compared to the empirical distribution of CVC under the null hypothesis of no interaction derived by random permutations of the phenotypes.

References

    1. Cordell HJ. Detecting gene–gene interactions that underlie human diseases. Nat Rev Genet 2009;10:392–404. - PMC - PubMed
    1. Ritchie MD, Hahn LW, Roodi N, et al. Multifactor-dimensionality reduction reveals high-order interactions among estrogen-metabolism genes in sporadic breast cancer. Am J Hum Genet 2001;69:138–47. - PMC - PubMed
    1. Cho YM, Ritchie MD, Moore JH, et al. Multifactor-dimensionality reduction shows a two-locus interaction associated with Type 2 diabetes mellitus. Diabetologia 2004;47:549–54. - PubMed
    1. Neuman RJ, Wasson J, Atzmon G, et al. Gene-gene interactions lead to higher risk for development of type 2 diabetes in an Ashkenazi Jewish population. PloS One 2010;5:e9903. - PMC - PubMed
    1. Tsai CT, Lai LP, Lin JL, et al. Renin-angiotensin system gene polymorphisms and atrial fibrillation. Circulation 2004;109:1640–6. - PubMed

Publication types

MeSH terms