. 2015 Jun 25:13:44.
doi: 10.1186/s12915-015-0155-z.

The role of juvenile hormone and insulin/TOR signaling in the growth of Manduca sexta

Affiliations

The role of juvenile hormone and insulin/TOR signaling in the growth of Manduca sexta

Nicole E Hatem et al. BMC Biol. .

Abstract

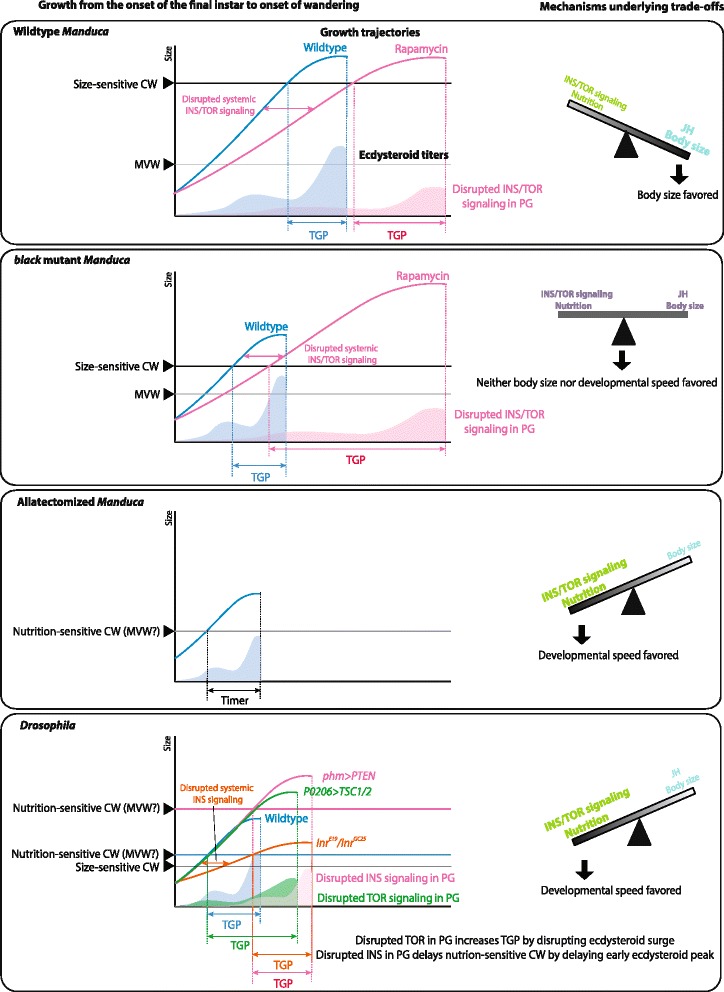
Background: In many insect species, fitness trade-offs exist between maximizing body size and developmental speed. Understanding how various species evolve different life history strategies requires knowledge of the physiological mechanisms underlying the regulation of body size and developmental timing. Here the roles of juvenile hormone (JH) and insulin/target of rapamycin (TOR) signaling in the regulation of the final body size were examined in the tobacco hornworm, Manduca sexta.

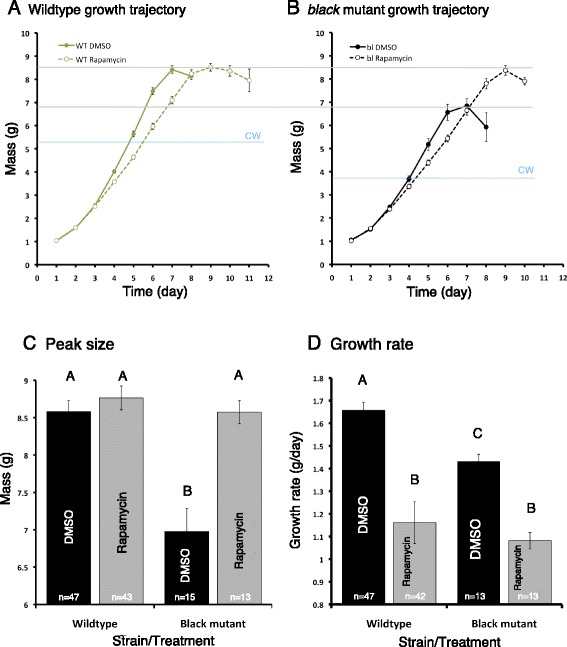
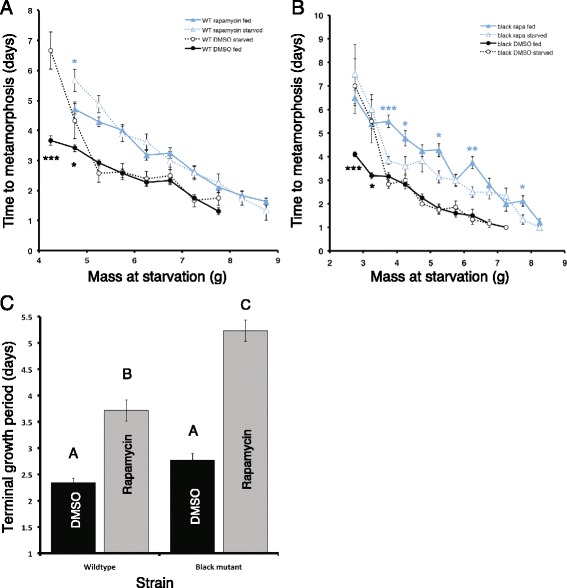
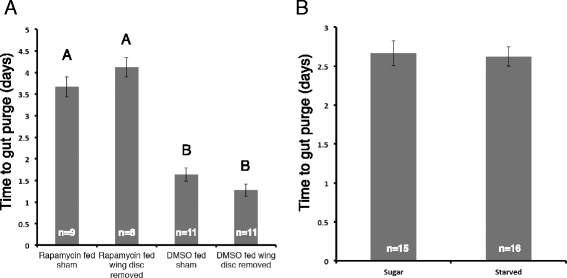
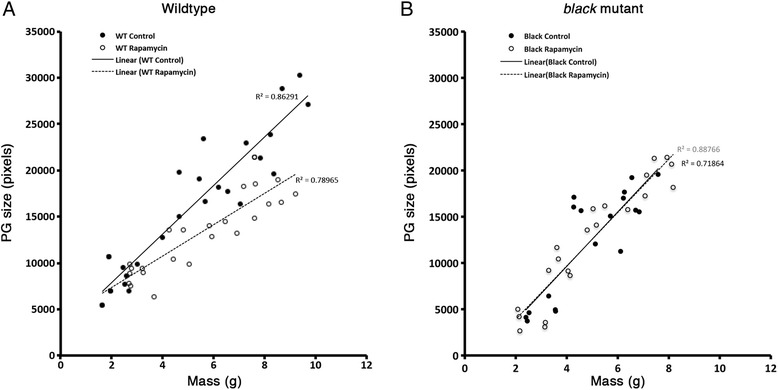
Results: Feeding rapamycin to wild-type larvae decreased the growth rate but did not alter the peak size of the larvae. In contrast, feeding rapamycin to the JH-deficient black mutant larvae caused the larvae to significantly increase the peak size relative to the DMSO-fed control animals by lengthening the terminal growth period. Furthermore, the critical weight was unaltered by feeding rapamycin, indicating that in Manduca, the critical weight is not influenced by insulin/TOR signaling. In addition, post-critical weight starved black mutant Manduca given rapamycin underwent metamorphosis sooner than those that were fed, mimicking the "bail-out mechanism".

Conclusions: Our study demonstrates that JH masks the effects of insulin/TOR signaling in the determination of the final body size and that the critical weights in Drosophila and Manduca rely on distinct mechanisms that reflect different life history strategies. Our study also suggests that TOR signaling lengthens the terminal growth period in Manduca as it does in Drosophila, and that JH levels determine the relative contributions of nutrient- and body size-sensing pathways to metamorphic timing.


Figures

Fig. 1
Fig. 1
Growth trajectories of wild-type and black mutant fifth instar Manduca larvae fed rapamycin or DMSO. a, b The growth trajectories of the wild-type (a) and the black mutant (b) larvae. The solid line with closed circles is the control animals and the dashed line with open circles is the rapamycin-treated animals. Blue lines represent critical weights as determined in Fig. 3. c, d The average peak masses (c) and growth rates (d) of the two strains raised on different diet treatments. Gray bars represent animals reared on diets with rapamycin, and black bars represent those reared on diets with DMSO. Bars with different letters represent statistically significant differences (one-way ANOVA, P < 0.001 for the peak masses and P < 0.0001 for growth rates). Error bars represent standard errors
Fig. 2
Fig. 2
Effect of methoprene application on the growth of black mutant larvae. Larvae were treated with either 50 μg methoprene (dashed line with open circles) or acetone (solid line with closed circles) and weighed daily
Fig. 3
Fig. 3
Critical weight determination of wild-type and black mutant larvae on rapamycin-treated diets. a, b Critical weight determination of wild-type (a) and black mutant larvae (b) on DMSO- or rapamycin-treated diets. The x-axis indicates the weight at which the animals were switched from the nutritive diet to the non-nutritive diet, and the y-axis represents the time from starvation to gut purge (measured in days). Black and blue lines represent animals fed a DMSO- or a rapamycin-treated diet, respectively. The solid lines and closed symbols represent larvae that were not starved, and the dotted lines and open symbols represent starved animals. Student’s t-test was used to compare the means for each weight category. *denotes P < 0.05; **denotes P < 0.001; ***denotes P < 0.0001. c The terminal growth period of wild-type and black mutant larvae on DMSO- or rapamycin-treated diets. Error bars represent standard errors
Fig. 4
Fig. 4
Effect of rapamycin on phospho-4E-BP and phospho-Akt expression in the fat body, wing discs, and prothoracic glands of wild-type and black mutant larvae. Tissues were pooled from 10 fifth instar larvae fed DMSO or rapamycin for one day. α-Tubulin was used as a loading control
Fig. 5
Fig. 5
The effect of imaginal disc removal and sugar diet on metamorphic timing in black mutants. a The effect of wing imaginal disc removal on the time to gut purge in black mutant larvae fed diets with DMSO or rapamycin. Sham represents control for physical removal of imaginal discs. Different letters indicate statistically significant difference (one-way ANOVA, post hoc Tukey test, P < 0.0001). b Effect of sugar or starved diets on time to gut purge in black mutant larvae fed rapamycin. Error bars represent standard errors
Fig. 6
Fig. 6
The relative growth of the prothoracic gland. a, b The growth of the prothoracic gland relative to body size in wild-type (a) and black mutant (b) Manduca fed diet with DMSO (solid line) or rapamycin (dotted line)
Fig. 7
Fig. 7
A model showing the effects of JH and insulin/TOR signaling on the timing of metamorphosis. (Left) The attainment of nutrition-sensitive critical weight is influenced by insulin signaling in the prothoracic glands [12], whereas the attainment of the size-sensitive critical weight determines the time when JH is cleared from the hemolymph [5]. Depending on the time when the size-sensitive critical weight is attained, the relative contribution of insulin signaling on the final body size changes. The model shows how JH and insulin/TOR signaling influence the growth of wild-type, black mutant, and allatectomized Manduca, and Drosophila [12, 14, 19]. (Right) The seesaw diagrams represent the mechanisms underlying trade-offs between maximizing body size and faster development. The relative contributions of JH signaling and insulin/TOR signaling pathways differ between Manduca and Drosophila: maximal body size is favored in Manduca, whereas developmental speed is favored in Drosophila

Comment in

References

    1. Nylin S, Gotthard K. Plasticity in life-history traits. Annu Rev Entomol. 1998;43:63–83. doi: 10.1146/annurev.ento.43.1.63. - DOI - PubMed
    1. Nijhout HF. Size matters (but so does time), and it’s OK to be different. Dev Cell. 2008;15:491–2. doi: 10.1016/j.devcel.2008.09.014. - DOI - PubMed
    1. Shingleton AW, Frankino WA, Flatt T, Nijhout HF, Emlen DJ. Size and shape: the developmental regulation of static allometry in insects. BioEssays. 2007;29:536–48. doi: 10.1002/bies.20584. - DOI - PubMed
    1. Nijhout HF, Davidowitz G, Roff DA. A quantitative analysis of the mechanism that controls body size in Manduca sexta. J Biol. 2006;5:16. doi: 10.1186/jbiol43. - DOI - PMC - PubMed
    1. Nijhout HF, Williams CM. Control of molting and metamorphosis in tobacco hornworm, Manduca-sexta (L) - cessation of juvenile-hormone secretion as a trigger for pupation. J Exp Biol. 1974;61:493–501. - PubMed

Publication types