Characterization of linkage disequilibrium, consistency of gametic phase and admixture in Australian and Canadian goats
- PMID: 26108536
- PMCID: PMC4479065
- DOI: 10.1186/s12863-015-0220-1
Characterization of linkage disequilibrium, consistency of gametic phase and admixture in Australian and Canadian goats
Abstract
Background: Basic understanding of linkage disequilibrium (LD) and population structure, as well as the consistency of gametic phase across breeds is crucial for genome-wide association studies and successful implementation of genomic selection. However, it is still limited in goats. Therefore, the objectives of this research were: (i) to estimate genome-wide levels of LD in goat breeds using data generated with the Illumina Goat SNP50 BeadChip; (ii) to study the consistency of gametic phase across breeds in order to evaluate the possible use of a multi-breed training population for genomic selection and (iii) develop insights concerning the population history of goat breeds.
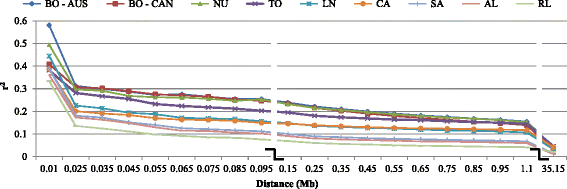
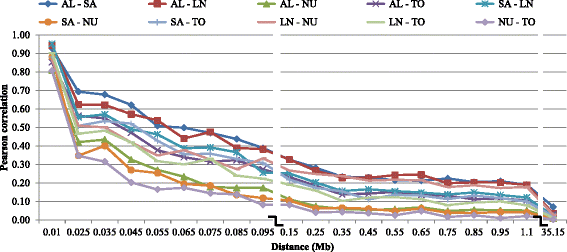
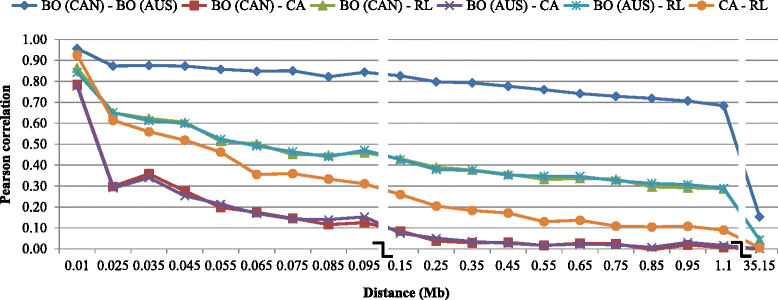
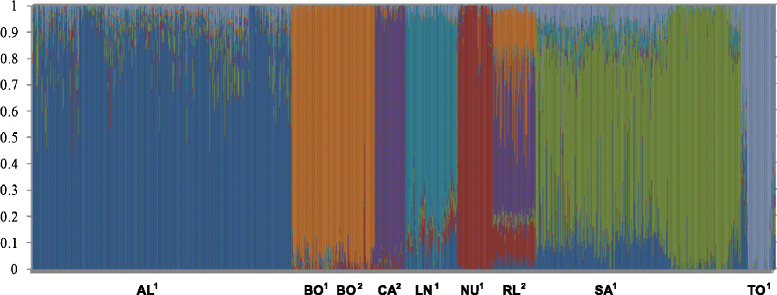
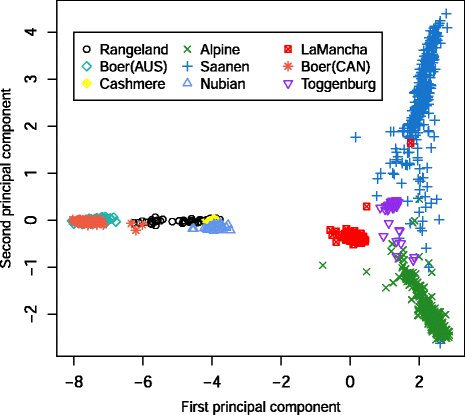
Results: Average r(2) between adjacent SNP pairs ranged from 0.28 to 0.11 for Boer and Rangeland populations. At the average distance between adjacent SNPs in the current 50 k SNP panel (~0.06 Mb), the breeds LaMancha, Nubian, Toggenburg and Boer exceeded or approached the level of linkage disequilibrium that is useful (r(2) > 0.2) for genomic predictions. In all breeds LD decayed rapidly with increasing inter-marker distance. The estimated correlations for all the breed pairs, except Canadian and Australian Boer populations, were lower than 0.70 for all marker distances greater than 0.02 Mb. These results are not high enough to encourage the pooling of breeds in a single training population for genomic selection. The admixture analysis shows that some breeds have distinct genotypes based on SNP50 genotypes, such as the Boer, Cashmere and Nubian populations. The other groups share higher genome proportions with each other, indicating higher admixture and a more diverse genetic composition.
Conclusions: This work presents results of a diverse collection of breeds, which are of great interest for the implementation of genomic selection in goats. The LD results indicate that, with a large enough training population, genomic selection could potentially be implemented within breed with the current 50 k panel, but some breeds might benefit from a denser panel. For multi-breed genomic evaluation, a denser SNP panel also seems to be required.
Figures

References
Publication types
MeSH terms
LinkOut - more resources
Full Text Sources
Other Literature Sources
Research Materials
Miscellaneous

