. 2015 Jun 25:6:7518.
doi: 10.1038/ncomms8518.

The sorting protein PACS-2 promotes ErbB signalling by regulating recycling of the metalloproteinase ADAM17

Affiliations

The sorting protein PACS-2 promotes ErbB signalling by regulating recycling of the metalloproteinase ADAM17

Sarah Louise Dombernowsky et al. Nat Commun. .

Abstract

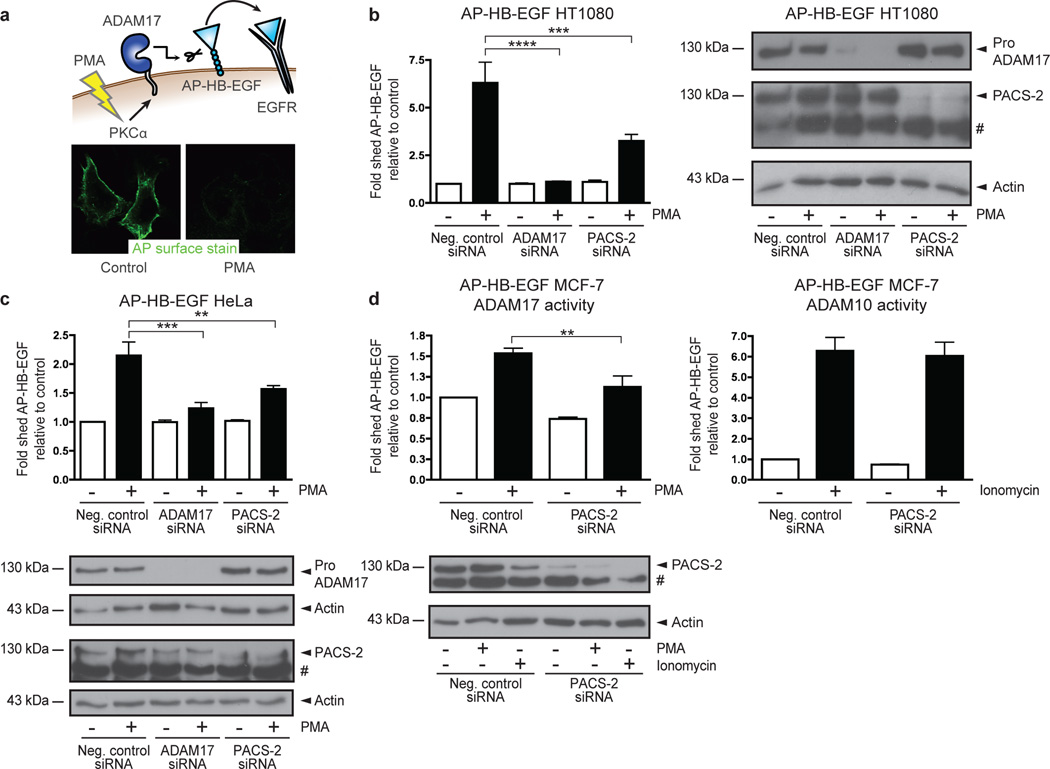
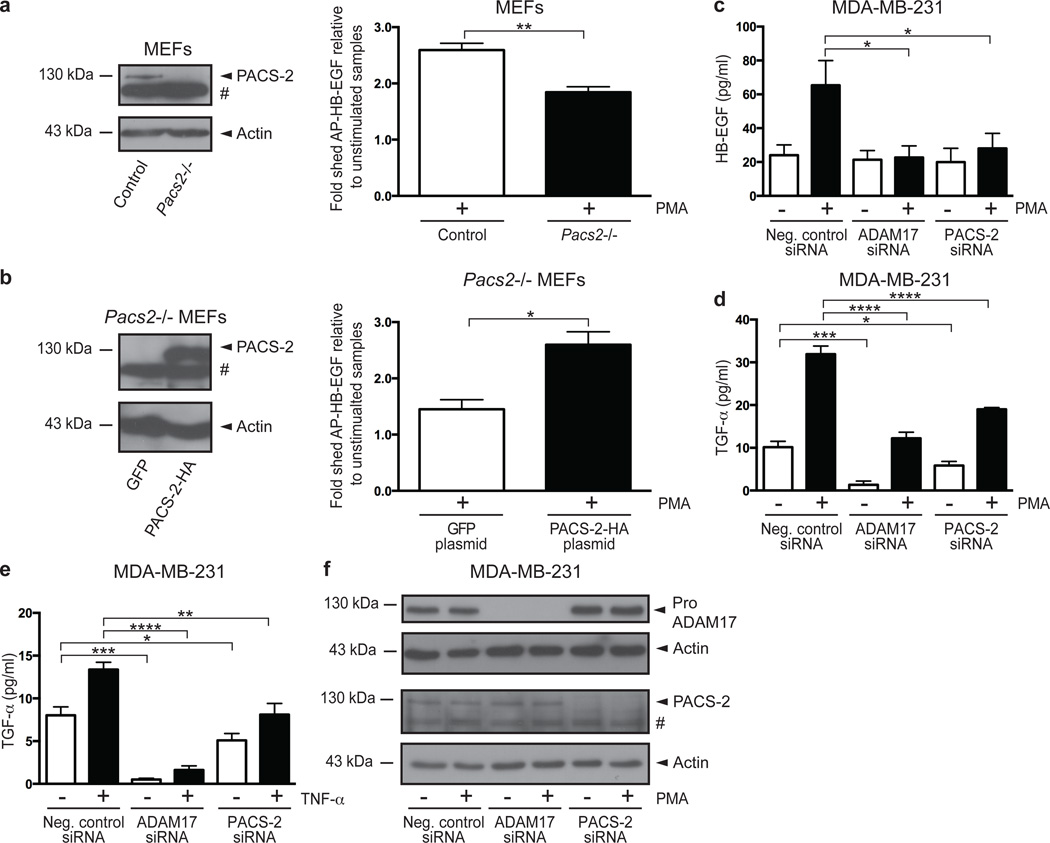
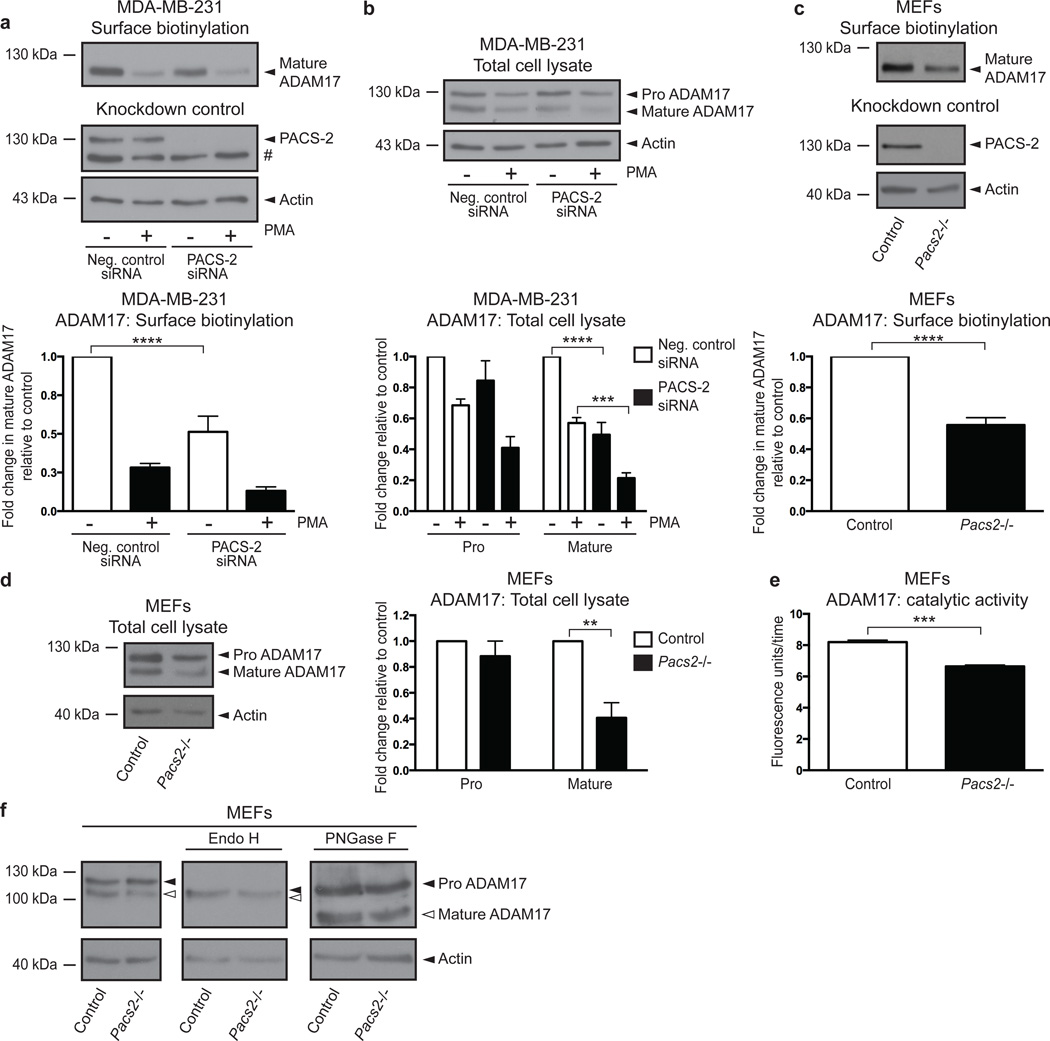
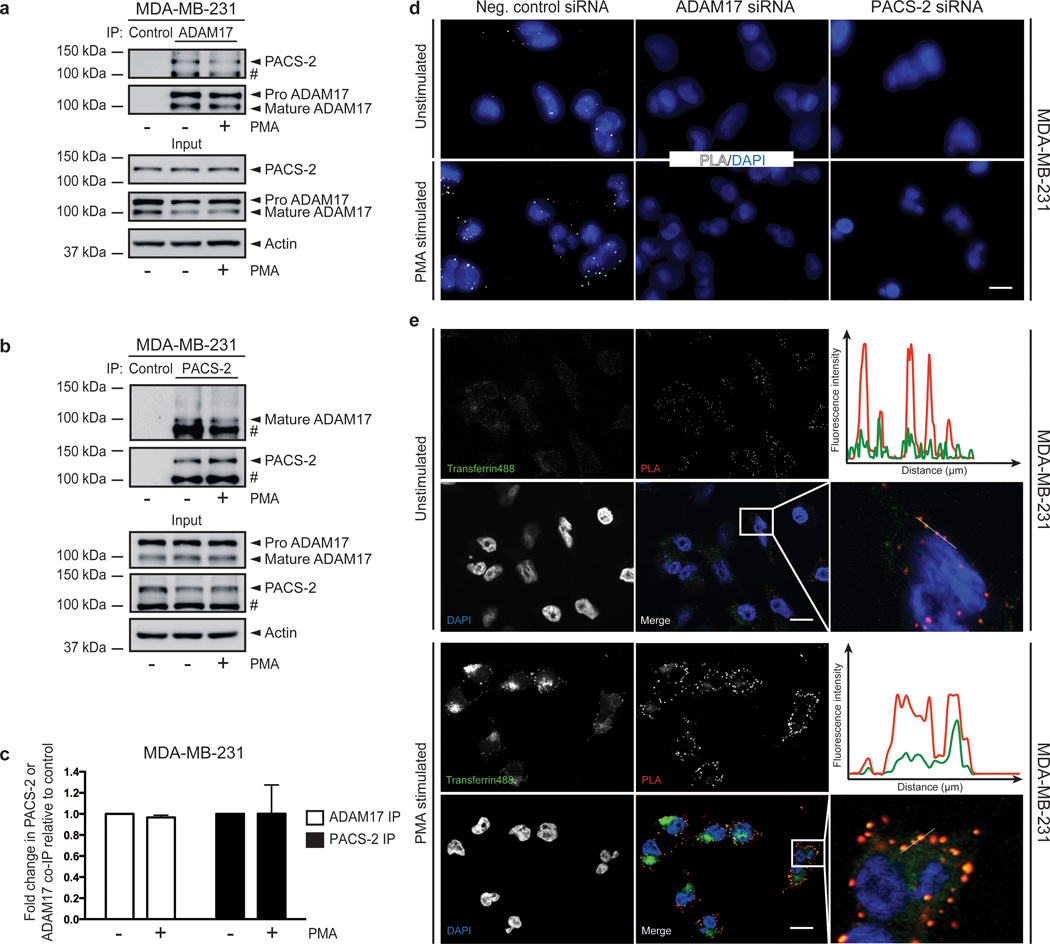
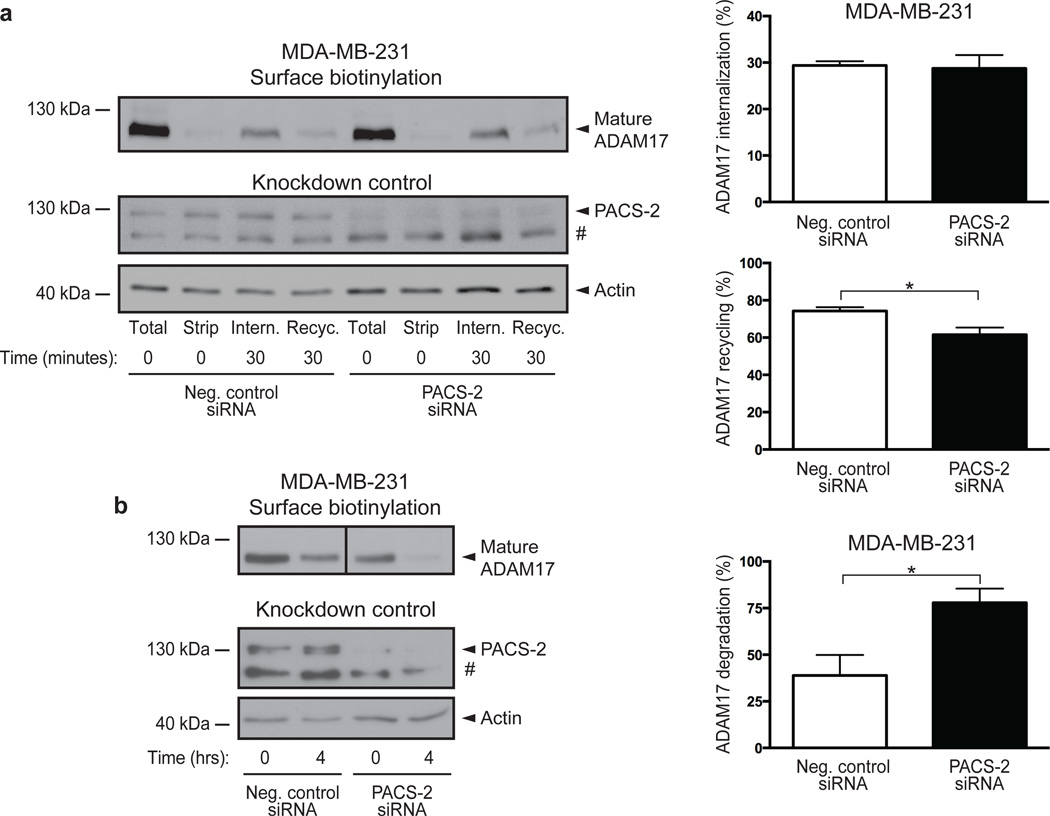
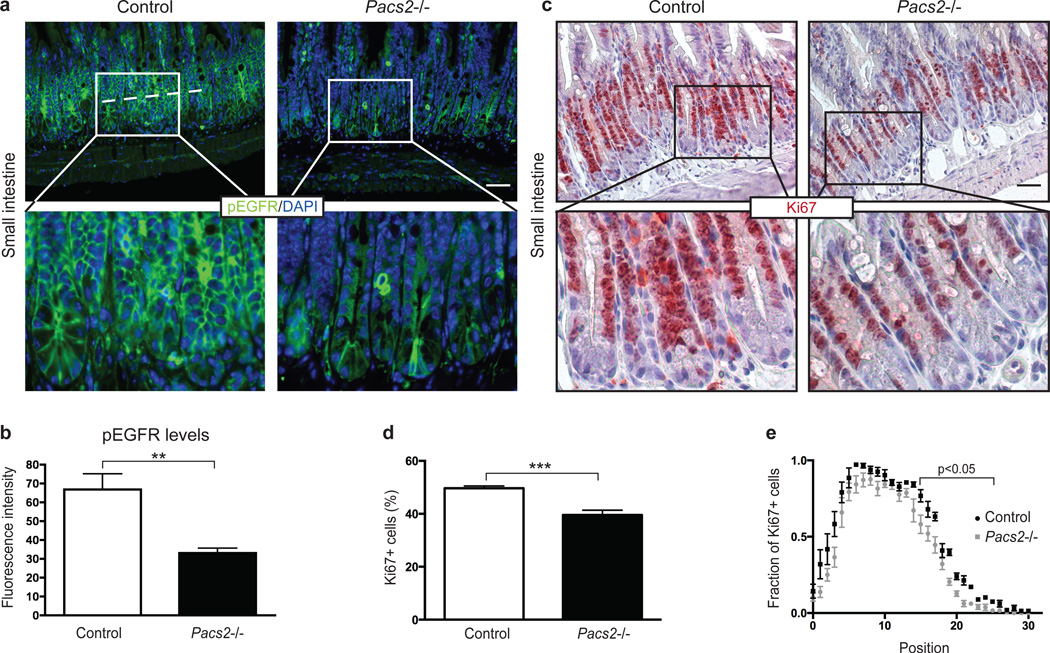
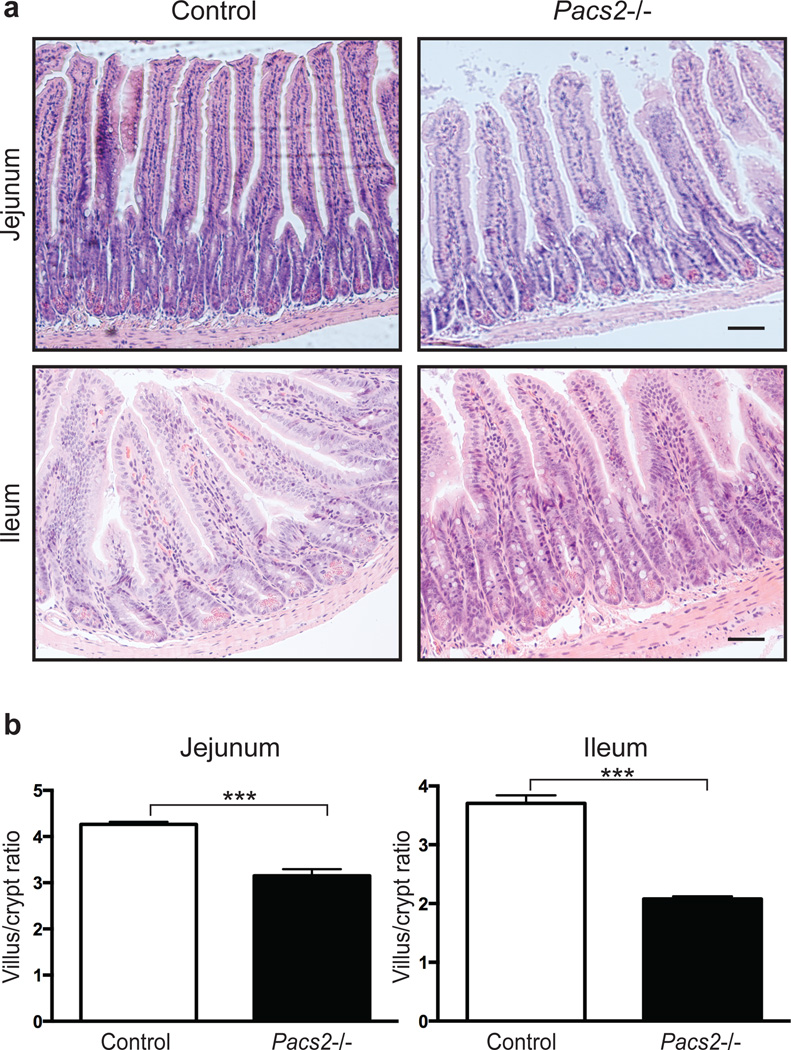
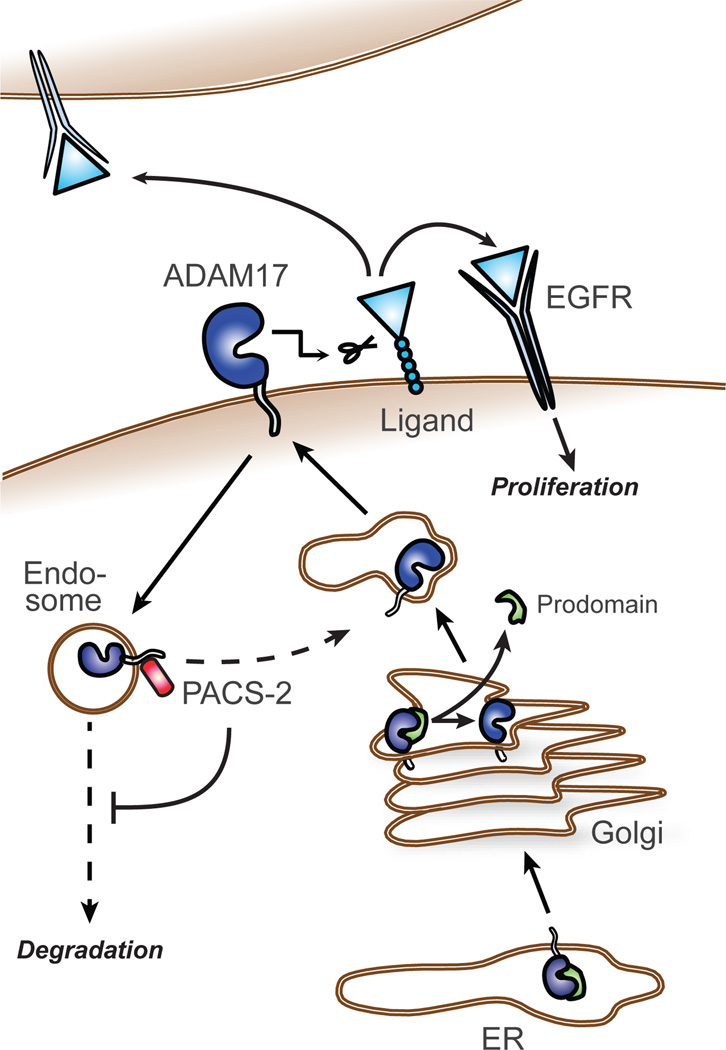
The metalloproteinase ADAM17 activates ErbB signalling by releasing ligands from the cell surface, a key step underlying epithelial development, growth and tumour progression. However, mechanisms acutely controlling ADAM17 cell-surface availability to modulate the extent of ErbB ligand release are poorly understood. Here, through a functional genome-wide siRNA screen, we identify the sorting protein PACS-2 as a regulator of ADAM17 trafficking and ErbB signalling. PACS-2 loss reduces ADAM17 cell-surface levels and ADAM17-dependent ErbB ligand shedding, without apparent effects on related proteases. PACS-2 co-localizes with ADAM17 on early endosomes and PACS-2 knockdown decreases the recycling and stability of internalized ADAM17. Hence, PACS-2 sustains ADAM17 cell-surface activity by diverting ADAM17 away from degradative pathways. Interestingly, Pacs2-deficient mice display significantly reduced levels of phosphorylated EGFR and intestinal proliferation. We suggest that this mechanism controlling ADAM17 cell-surface availability and EGFR signalling may play a role in intestinal homeostasis, with potential implications for cancer biology.


Figures

Fig. 1
Fig. 1. Genome-wide screen identifies PACS-2 as an ADAM17 regulator
(a) Cellular model system used for the genome-wide siRNA screen. 21,121 individual genes were knocked down using siRNAs and the effects on ADAM17-mediated shedding of AP-HB-EGF were measured by quantifying AP cell-surface staining after PMA stimulation. (b+c) siRNA-transfected AP-HB-EGF HT1080 (b) or AP-HB-EGF HeLa (c) cells were PMA-stimulated, and the cell medium analysed for AP activity. The fold change in AP-HB-EGF release was calculated by setting the unstimulated negative control for each experiment to 1, then normalizing the other raw data to this value, and finally calculating the average of all individual experiments. Data in (b) were compiled from 6 individual experiments and in (c) from 3 individual experiments, each performed in triplicate. (d) AP-HB-EGF MCF-7 cells were siRNA-transfected and stimulated with PMA (left-hand panel) or ionomycin (right-hand panel). Conditioned medium was analysed for AP activity as in (b+c). Data were compiled from 4 individual experiments, each performed in triplicate. In all cases, knockdown was confirmed by western blot. On blots, # denotes a non-specific band. Graphs show mean values ± standard error of the mean (SEM). Data were analysed by ANOVA. **p<0.01, ***p<0.001, ****p<0.0001.
Fig. 2
Fig. 2. PACS-2 regulates ADAM17-mediated shedding
(a) AP-HB-EGF was transiently expressed in control and Pacs2−/− MEFs. Cells were PMA-stimulated, and the cell medium analysed for AP activity. To overcome differences in transfection efficiency, fraction of shed AP-HB-EGF was calculated as AP-HB-EGF released to the medium divided by the total amount of AP-HB-EGF in the medium and cell lysate. The fold change in AP-HB-EGF release was then calculated by setting the unstimulated negative control for each experiment to 1, then normalizing the other raw data to this value, and finally calculating the average of all individual experiments. The PMA-stimulated fold increase in AP-HB-EGF shedding depicted for each cell line. Data were compiled from 4 individual experiments, each performed in triplicate. (b) AP-HB-EGF was expressed in Pacs2−/− MEFs together with green fluorescent protein (GFP) or PACS-2-HA and shedding analysed as in (a). Data were compiled from 3 individual experiments, each performed in triplicate. (c-e) siRNA-transfected MDA-MB-231 cells were stimulated with PMA (c+d) or TNF-α (e). The medium was analysed by ELISA for shed HB-EGF (c) or TGF-α (d+e), shown as concentrations in pg/ml. In all cases, data were compiled from 3 individual experiments, each performed in triplicate. (f) Representative western blots showing knockdown in cells used for ELISA. On blots, # denotes a non-specific band. Graphs show mean values ± SEM. Data were analysed by ANOVA or unpaired two-tailed Student’s t-test, as appropriate. *p<0.05, **p<0.01, ***p<0.001, ****p<0.0001.
Fig. 3
Fig. 3. PACS-2 regulates cell-surface availability of mature ADAM17
(a+b) MDA-MB-231 cells were siRNA-transfected and PMA-stimulated. Cells were surface biotinylated and analysed by western blot. ADAM17 levels were normalized to input actin and fold changes were calculated by setting the unstimulated negative control for each experiment to 1, then normalizing the other raw data to this value, and finally calculating the average of all individual experiments. Cell-surface levels of mature ADAM17 (a) and total cellular levels of pro and mature ADAM17 (b) are shown with data compiled from 4 individual experiments. (c+d) Unstimulated cell-surface levels of mature ADAM17 (c) and total cellular levels of pro and mature ADAM17 (d) in control and Pacs2−/− MEFs were analysed as in (a+b). Data were compiled from 4 individual experiments in (c) and 3 individual experiments in (d). (e) ADAM17 was immunoprecipitated from unstimulated control and Pacs2−/− MEFs and its activity assessed using an ADAM17 quenched fluorescence peptide substrate. The graph shows the average gradient (fluorescence units/time) of the linear regressions describing enzymatic activity. The data were compiled from 3 individual experiments, each performed in triplicate. (f) Lysates from control and Pacs2−/− MEFs were treated with EndoH or PNGase F and the effects on ADAM17 examined by western blot. The images shown are derived from the same blot but different exposures (indicated by separate panels). The blot shown is representative of 3 individual experiments. On blots, # denotes a non-specific band. Graphs show mean values ± SEM. Data were analysed by ANOVA or unpaired two-tailed Student’s t-test, as appropriate. **p<0.01, ***p<0.001, ****p<0.0001.
Fig. 4
Fig. 4. PACS-2 interacts with ADAM17 in endocytic compartments
(a-b) ADAM17 (a) or PACS-2 (b) was immunoprecipitated (IP) from unstimulated and PMA-stimulated MDA-MB-231 cells (b), and co-immunoprecipitation (co-IP) of PACS-2 (a) or ADAM17 (b) detected by western blot. The blots shown are representative of three individual experiments and # denotes a non-specific band. (c) The effect of PMA stimulation on PACS-2/ADAM17 co-immunoprecipitation in (a) and (b) was quantified. The amount of co-immunoprecipitated PACS-2 (a) or mature ADAM17 (b) was normalized to the amount of immunoprecipitated mature ADAM17 (a) or PACS-2 (b). The unstimulated negative control for each experiment was then set to 1, the other raw data were normalized to this value, and finally the average of all individual experiments was calculated. Data were analysed by unpaired two-tailed Student’s t-test. (d) MDA-MB-231 cells were transfected with siRNA and subjected to Proximity Ligation Assay (PLA) with or without PMA stimulation. The experiment was performed 10 times in duplicate. Two experiments included the knockdown controls. Scale bar represents 7 µm. (e) Before PLA, MDA-MB-231 cells were left unstimulated or treated with PMA and subsequently allowed to internalize fluorescent transferrin for 5 minutes. Scale bar represents 14 µm. Fluorescence intensities were quantified along the lines on the enlarged images and depicted on the graphs. The experiment was performed 4 times in duplicate.
Fig. 5
Fig. 5. PACS-2 diverts endocytosed ADAM17 away from degradative pathways
(a) MDA-MB-231 cells were surface labelled using cleavable biotin. Labelled cell-surface proteins were allowed to internalize for 30 minutes and remaining biotinylated proteins on the cell surface were removed (Intern.). Internalized proteins were then allowed to recycle for 30 minutes, after which recycled protein was stripped from the cell surface (Recyc.). The amount of cell surface ADAM17 was first normalized to input actin. The percentage internalization was calculated relative to total cell surface ADAM17 levels (Total). Recycling was determined by first subtracting the amount of biotinylated protein left after recycling from the amount of internalized protein, and then calculated as a percentage of internalized protein. To verify proper stripping of cell-surface proteins, a dish kept at 4°C was processed in parallel (Strip). Data were compiled from 5 individual experiments. (b) MDA-MB-231 cells were surface labelled using non-cleavable biotin, lysed at time zero, or incubated for 4 hours at 37°C to allow internalization and degradation of surface proteins. Percentage degradation was calculated by normalizing the amount of cell surface ADAM17 to input actin, and dividing the amount remaining after 4 hours with the amount present at time zero. Data were compiled from 3 individual experiments. The images shown are derived from the same blot and same exposure, but have been cropped for clarity (indicated by a separation line). On blots, # denotes a non-specific band. Graphs show mean values ± SEM. Data were analysed by unpaired two-tailed Student’s t-test. *p<0.05.
Fig. 6
Fig. 6. PACS-2 controls EGFR activity in vivo
(a) Immunohistochemistry for EGFR pY1068 and nuclear DAPI stain were performed on sections from the small intestine of 5 wildtype and 7 Pacs2−/− mice. The scale bar represents 43 µm. (b) For each section, four images were taken at corresponding random points and the fluorescence intensity of pEGFR quantified along a line averaging 193 µm across small intestinal crypts, represented by the dotted line in (a). (c) Immunohistochemistry for Ki67 on sections from the small intestine of 5 control and 6 Pacs2−/− mice. The scale bar represents 52 µm. (d) The percentage of Ki67 positive cells was quantified. For each mouse, over 900 crypt cells were scored, unless not enough well oriented crypts were available. (e) The position of Ki67 positive cells in small intestinal crypts was scored from crypt cell position 0 (bottom) to 30 (top) and the number represented as a fraction out of the total number of cells counted for each position. Graphs show mean values ± SEM. Data were analysed by unpaired two-tailed Student’s t-test. **p<0.01, ***p<0.001.
Fig. 7
Fig. 7. PACS-2 regulates intestinal tissue homeostasis
(a) Histology of the small intestine of Pacs2−/− mice. Scale bars represent 63 µm. (b) The ratio of villus height to crypt depth in jejunum and ileum was quantified using 4 control and 4 Pacs2−/− mice. More than 100 villi were assessed for each genotype and segment. Graphs show mean values ± SEM. Data were analysed by unpaired two-tailed Student’s t-test. ***p<0.001.
Fig. 8
Fig. 8. A model of PACS-2 regulation of ADAM17 and EGFR activity
The ADAM17 proform mainly resides in the secretory apparatus, and during its transit to the cell surface, furin-mediated cleavage generates the mature (active) form. We propose that PACS-2 controls ADAM17 cell-surface availability by diverting endocytosed ADAM17 away from degradative pathways and towards sustained ErbB ligand shedding and EGFR activation. PACS-2 is therefore an important regulator of auto- para-, and juxtacrine ErbB signalling in vivo.

References

    1. Arribas J, Esselens C. ADAM17 as a therapeutic target in multiple diseases. Curr. Pharm. Des. 2009;15:2319–2335. - PubMed
    1. Blobel CP. ADAMs: key components in EGFR signalling and development. Nat. Rev. Mol. Cell Biol. 2005;6:32–43. - PubMed
    1. Murphy G. The ADAMs: signalling scissors in the tumour microenvironment. Nat. Rev. Cancer. 2008;8:929–941. - PubMed
    1. Borrell-Pages M, Rojo F, Albanell J, Baselga J, Arribas J. TACE is required for the activation of the EGFR by TGF-alpha in tumors. EMBO J. 2003;22:1114–1124. - PMC - PubMed
    1. Ardito CM, et al. EGF receptor is required for KRAS-induced pancreatic tumorigenesis. Cancer Cell. 2012;22:304–317. - PMC - PubMed

Publication types