. 2015 Oct 1;593(19):4411-22.
doi: 10.1113/JP270464. Epub 2015 Aug 11.

Increased gravitational force reveals the mechanical, resonant nature of physiological tremor

Affiliations

Increased gravitational force reveals the mechanical, resonant nature of physiological tremor

M Lakie et al. J Physiol. .

Abstract

Key points: Physiological hand tremor has a clear peak between 6 and 12 Hz, which has been attributed to both neural and resonant causes. A reduction in tremor frequency produced by adding an inertial mass to the limb has usually been taken as a method to identify the resonant component. However, adding mass to a limb also inevitably increases the muscular force required to maintain the limb's position against gravity, so ambiguous results have been reported. Here we measure hand tremor at different levels of gravitational field strength using a human centrifuge, thereby increasing the required muscular force to preserve limb position without changing the limb's inertia. By comparing the effect of added mass (inertia + force) versus solely added force upon hand acceleration, we conclude that tremor frequency can be almost completely explained by a resonant mechanical system.

Abstract: Human physiological hand tremor has a resonant component. Proof of this is that its frequency can be modified by adding mass. However, adding mass also increases the load which must be supported. The necessary force requires muscular contraction which will change motor output and is likely to increase limb stiffness. The increased stiffness will partly offset the effect of the increased mass and this can lead to the erroneous conclusion that factors other than resonance are involved in determining tremor frequency. Using a human centrifuge to increase head-to-foot gravitational field strength, we were able to control for the increased effort by increasing force without changing mass. This revealed that the peak frequency of human hand tremor is 99% predictable on the basis of a resonant mechanism. We ask what, if anything, the peak frequency of physiological tremor can reveal about the operation of the nervous system.


Figures

Figure 1
Figure 1. The dual effect of added mass
A mass is supported by a spring. Resonant frequency (RF, in Hz) is dictated by spring stiffness (k) and by mass (m). The equation is RF = 1/(2π)√(k/m). Left panel: increasing mass produces increased force (F) which causes extension (sag) in the supporting spring if k does not change. The decrease in RF with added mass is indicated in the amplitude frequency spectra (top row). The reduction in resonant frequency reflects only the added mass. Right panel: this symbolises the human postural system when mass is added to a limb. In order to support the load without sag (to maintain posture), increased muscular effort is required to generate increased upward force. This muscular activity increases stiffness, and the anticipated reduction in resonant frequency is partly offset. The spectra in the top row show the spectra with sag (copied from the left panel) with the spectra with no sag superimposed (spectra are displaced to the right, indicated by arrows).
Figure 2
Figure 2. Experimental setup
To the left of the picture is the centrifuge with one of its two pivoted gondolas at the end of its ∼10 m radius arm. The inset shows a subject strapped into the seat. A thermoplastic splint ensured the hand and fingers moved as one. A laser rangefinder situated above the hand was used to monitor its vertical position, which was displayed to the subject on a screen just out of shot on the right of the picture. The accelerometer is located on top of the hand splint but is too small to be seen distinctly. The EMG electrodes lie underneath the protective bandaging on the forearm.
Figure 3
Figure 3. Representative subject data
Tremor acceleration spectra when load is increased in the centrifuge (left panel) or by adding mass (right panel). With added gravitational field strength the tremor size increases and the frequency rises somewhat. With added mass, the tremor size decreases slightly and the frequency falls.
Figure 4
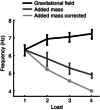
Figure 4. Group mean tremor frequency
The tremor peak frequency (mean and SEM) in both conditions; increased g (black) and increased mass (dark grey) for each load. The corrected values for each load (decrease caused by mass minus increase caused by g) are also plotted (light grey).
Figure 5
Figure 5. Estimated hand mass
The corrected values and non‐corrected values of the added mass condition from Fig. 4 are plotted as oscillation period (Period) squared vs. added mass. Both lines provide a very good fit to the data points. Extrapolation to the point where the regression line cuts the x‐axis yields the amount of mass that would have to be removed to reduce the Period to zero – that is, the mass of the hand and splint. The uncorrected values predict a mass of ∼1.1 kg, whereas the corrected values predict a mass of ∼0.5 kg.
Figure 6
Figure 6. Mean filtered rectified extensor EMG at each load (±SEM)
Figure 7
Figure 7. Mean extensor EMG spectra
Left panel shows the effect of increasing g. Right panel shows the effect of increasing mass. At each load the overall level of EMG is similar and the spectra all have a similar shape. It is clear that in the higher g conditions, but not in any of the other conditions, there is an emergent small peak close to the frequency of the tremor.
Figure 8
Figure 8. Mean amplitude of peak tremor acceleration at each load (±SEM)
Figure 9
Figure 9. The relationship between area of the hand and volume for 14 subjects
The equation of the regression line was used subsequently to estimate the hand volume of the 7 different subjects that we used in the centrifuge experiments.
Figure 10
Figure 10. The relationship between oscillation period squared and added mass for a resonant system
Figure 11
Figure 11. The relationship between resonant frequency squared and g

References

    1. Cannon SC & Zahalak I (1982). The mechanical behavior of active human skeletal muscle in small oscillations. J Biomech 15, 111–121. - PubMed
    1. Clarys JP & Marfell‐Jones MJ (1986). Anthropometric prediction of component tissue masses in the minor limb segments of the human. Hum Biol 58, 761–769. - PubMed
    1. Clauser CE, McConville JT & Young JW (1969). Weight, volume and center of mass of segments of the human body. Aerospace Medical Research Laboratory (U.S.). Technical report.
    1. De Leva P (1996). Adjustments to Zatsiorsky‐Seluyanov's segment inertia parameters. J Biomech 29, 1223–1230. - PubMed
    1. Drillis R, Contini R & Bluestein M (1964). Body segment parameters. A survey of measurement techniques. Artif Limbs 8, 44–66. - PubMed

Publication types