. 2015 Jun 15;29(12):1256-70.
doi: 10.1101/gad.257840.114.

DNA methylation restrains transposons from adopting a chromatin signature permissive for meiotic recombination

Affiliations

DNA methylation restrains transposons from adopting a chromatin signature permissive for meiotic recombination

Natasha Zamudio et al. Genes Dev. .

Abstract

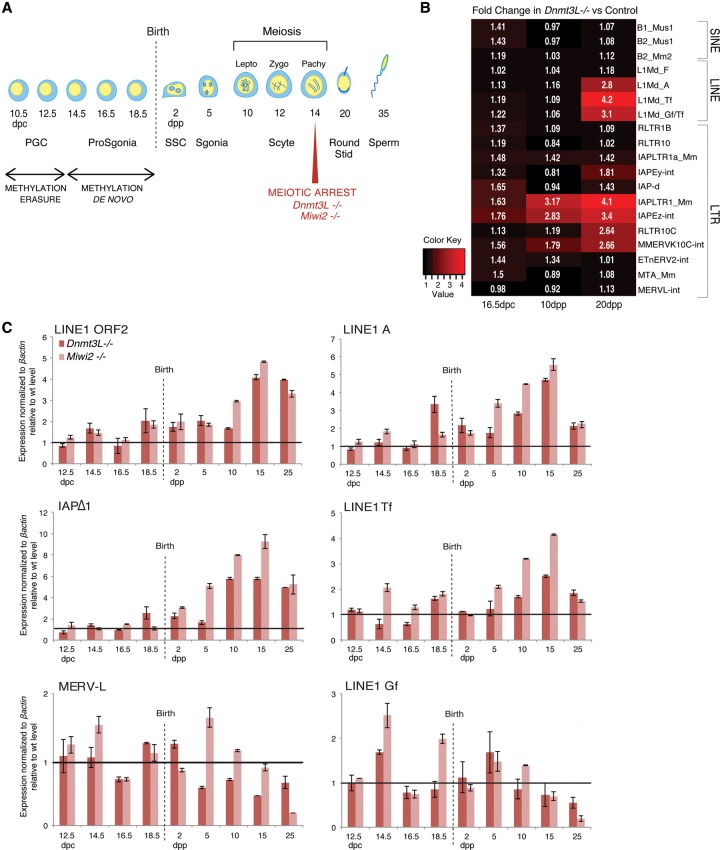
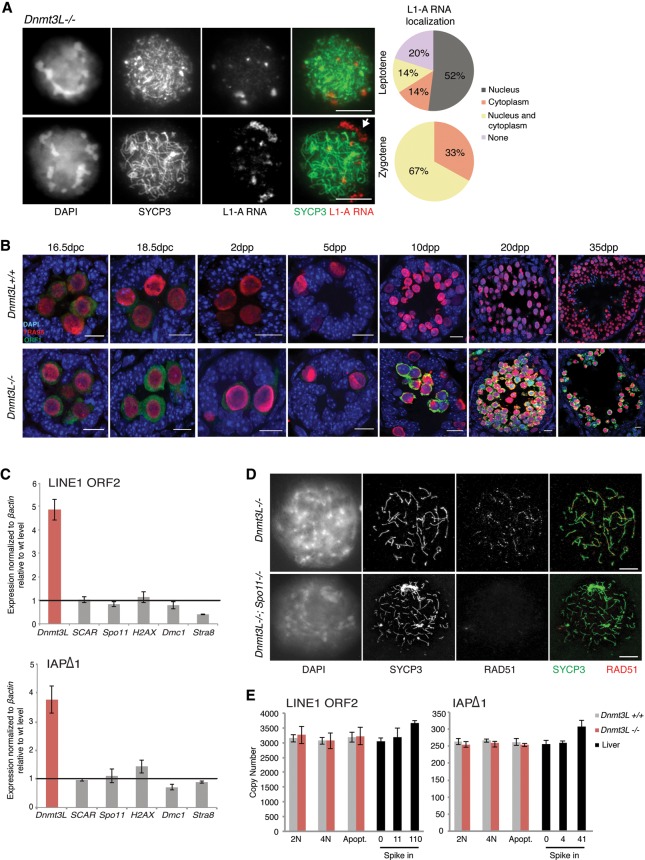
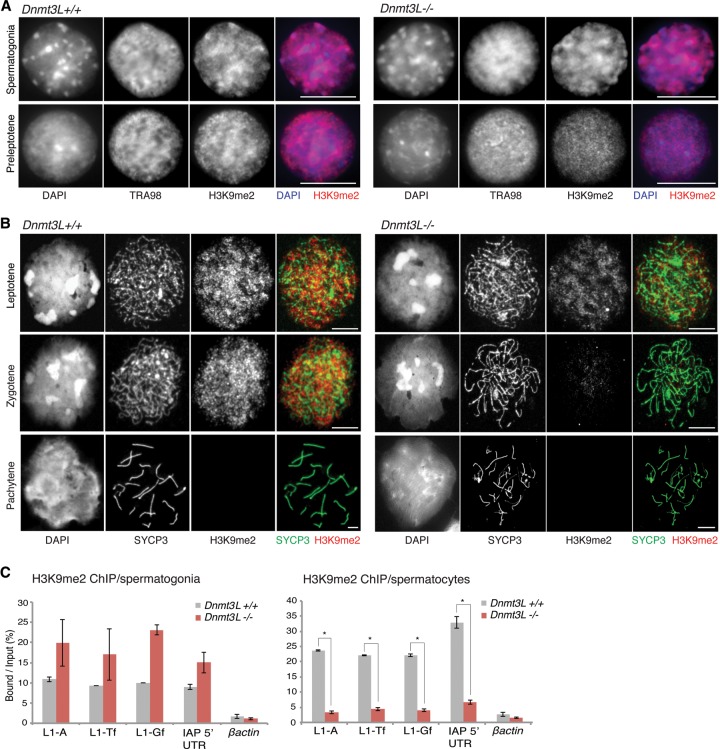
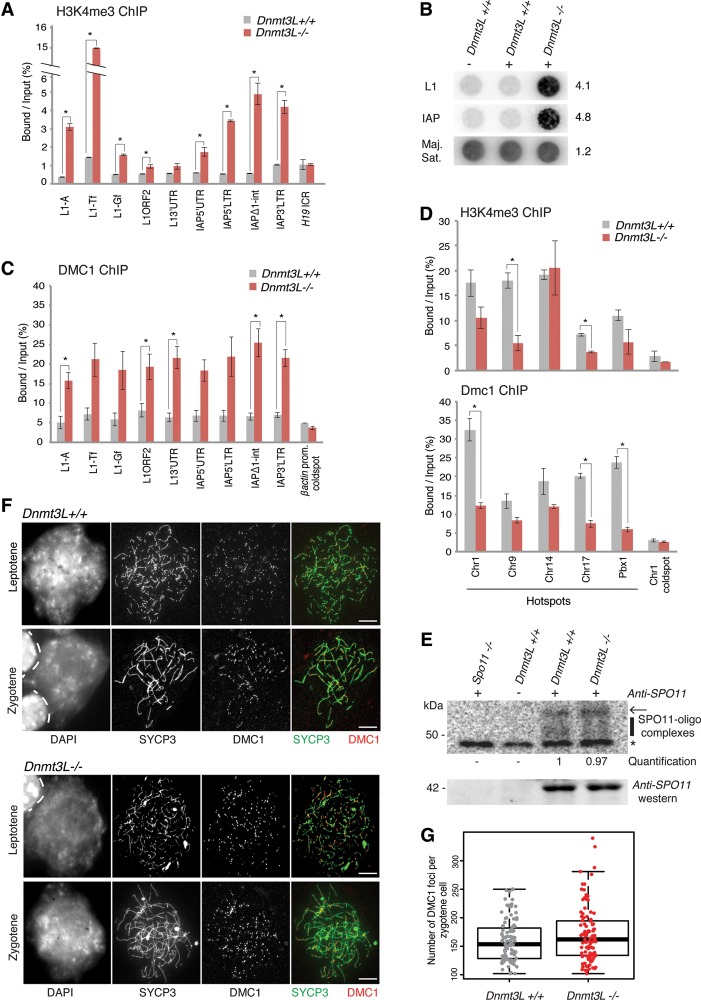
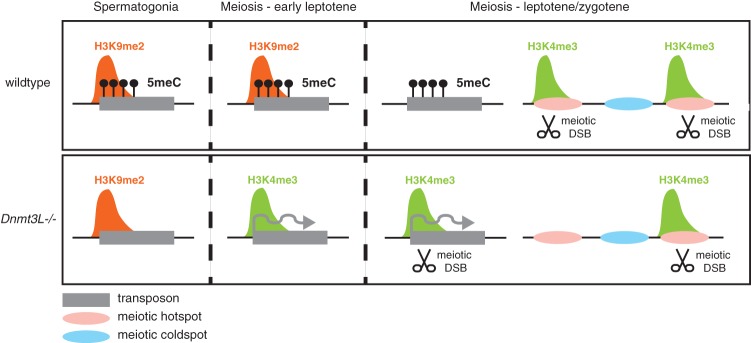
DNA methylation is essential for protecting the mammalian germline against transposons. When DNA methylation-based transposon control is defective, meiotic chromosome pairing is consistently impaired during spermatogenesis: How and why meiosis is vulnerable to transposon activity is unknown. Using two DNA methylation-deficient backgrounds, the Dnmt3L and Miwi2 mutant mice, we reveal that DNA methylation is largely dispensable for silencing transposons before meiosis onset. After this, it becomes crucial to back up to a developmentally programmed H3K9me2 loss. Massive retrotransposition does not occur following transposon derepression, but the meiotic chromatin landscape is profoundly affected. Indeed, H3K4me3 marks gained over transcriptionally active transposons correlate with formation of SPO11-dependent double-strand breaks and recruitment of the DMC1 repair enzyme in Dnmt3L(-/-) meiotic cells, whereas these features are normally exclusive to meiotic recombination hot spots. Here, we demonstrate that DNA methylation restrains transposons from adopting chromatin characteristics amenable to meiotic recombination, which we propose prevents the occurrence of erratic chromosomal events.

Keywords: DNA methylation; chromatin; fertility; germ cells; meiosis; transposons.


Figures

Figure 1.
Figure 1.
Dynamics of transposon regulation during Dnmt3L−/− and Miwi2−/− spermatogenesis. (A) A scheme of mouse spermatogenesis is shown with the timing of appearance of the different germ cell types and the process of DNA methylation reprogramming. DNA demethylation and piRNA-directed de novo DNA methylation occur during fetal stages in primordial germ cells (PGCs) and prospermatogonia (ProSgonia), respectively. After birth, the first cohort of germ cells synchronously differentiate throughout spermatogenesis; entry into prophase of meiosis I occurs ∼10 dpp (days post-partum). Mutations into components of the piRNA-directed DNA methylation pathway, such as Dnmt3L and Miwi2, result in a meiotic arrest at mid-pachytene. (SSC) Spermatogonial stem cells; (Sgonia) spermatogonia; (Scyte) spermatocyte; (Lepto) leptotene; (Zygo) zygotene; (Pachy) pachytene; (Stid) spermatid (Sperm) spermatozoa. (B) Heat maps showing expression fold changes of different TEs (listed at the right) in Dnmt3L−/− testes, as determined by RNA-seq at 16.5 dpc, 10 dpp, and 20 dpp relative to age-matched control littermates. TE elements with >300 reads per sample are shown. (C) Similar dynamics of TE expression in developing testes of Dnmt3L−/− (dark red) and Miwi2−/− (light red) mice relative to wild-type littermates. Values were normalized to βactin; similar changes were observed upon Rrm2 normalization (data not shown). Fold changes are shown as SEM from quantitative PCR (qPCR) technical duplicates.
Figure 2.
Figure 2.
TE reactivation occurs at meiosis onset but does not lead to major retrotransposition in Dnmt3L−/− spermatocytes. (A) 5′ untranslated region (UTR) L1-A RNA FISH detection combined with SYCP3 immunostaining of Dnmt3L−/− spermatocytes. Pie charts represent the cellular localization of L1-A RNA signals assessed from 100 leptotene and 100 zygotene cells from two animals. (White arrow) Perinuclear L1-A RNA accumulation. Bars, 10 µm. (B) Immunofluorescence detection of LINE1 ORF1 (green) and TRA98 (red) on Dnmt3L+/+ and Dnmt3L−/− testis sections with the prenatal and postnatal ages indicated. Although some ORF1 production can be seen at perinatal ages, up-regulation culminates after 15 dpp in Dnmt3L−/− gonads. Bars, 10 µm. (C) Lack of L1 and IAPΔ1 up-regulation in testes of five different meiotic mutants compared with age-matched Dnmt3L mutants (6 wk old). Error bars are as in Figure 1. (D) Representative microscopy images of double-immunofluorescence detection of SYCP3 (green) and the DSB repair enzyme RAD51 (red) on Dnmt3L−/− and Dnmt3L−/−; Spo11−/− meiotic spreads. RAD51 foci are not detectable in Dnmt3L−/−; Spo11−/− spermatocytes, indicating that SPO11-independent DNA breaks are not formed. Bars, 10 µm. (E) Absolute copy number of L1-ORF2 and IAPΔ1 fragments assayed by qPCR on DNA of 2N, 4N, and apoptotic cells FACS (fluorescence-activated cell sorting)-sorted from Dnmt3L+/+ and Dnmt3L−/− testes. Values are expressed as copies per genome, representing the average and SEM of three biological replicates; controls for detection of additional copies used liver DNA spiked in with known amounts of the targets, as indicated.
Figure 3.
Figure 3.
Alterations of H3K9me2 enrichment at TEs in early Dnmt3L−/− spermatocytes. (A) Double-immunofluorescence staining of H3K9me2 (red) and the germ cell marker TRA98 on Dnmt3L+/+ and Dnmt3L−/− spermatogonia and preleptotene spermatocytes. While the H3K9me2 signal is similar between wild-type and Dnmt3L−/− spermatogonia, it is reduced in Dnmt3L−/− preleptotene stage compared with wild type. Bars, 10 µm. (B) Double-immunofluorescence staining of SYCP3 (green) and H3K9me2 (red) on Dnmt3L+/+ and Dnmt3L−/− meiotic cells. Compared with wild type, the H3K9me2 signal is lower at the leptotene stage and completely absent at the zygotene stage in Dnmt3L−/− spermatocytes. Bars, 10 µm. (C) ChIP-qPCR quantification of H3K9me2 enrichment at various TEs in spermatogonia (left panel) and spermatocytes (right panel) isolated from Dnmt3L+/+ and Dnmt3L−/− testes. Quantitative data are expressed as the ratio of the ChIP (Bound) to the input DNA. Transposon-associated H3K9me2 levels are increased in Dnmt3L−/− spermatogonia compared with wild type, but differences are not significant overall. P > 0.05. However, in Dnmt3L−/− spermatocytes, decreased H3K9me2 levels are significant. Error bars indicate the SEM of two to three biological replicates. (*) P < 0.05, Student's t-test.
Figure 4.
Figure 4.
TE derepression remodels the meiotic chromatin landscape in Dnmt3L−/− spermatocytes. (A) Enrichment of H3K4me3 marks over TE sequences. ChIP was performed on Dnmt3L+/+ and Dnmt3L−/− testis cells; enrichment over several TEs and the H19 ICR was estimated by qPCR. Error bars indicate the SEM of two to three biological replicates. (*) P < 0.05, Student's t-test. (B) Enrichment of SPO11 cutting sites at TE sequences. SPO11-associated ssDNA fragments were immunoprecipitated from 12 dpp wild-type and 13 dpp Dnmt3L−/− testes. Dotted DNA was hybridized with L1-Tf and IAPEz full-length probes. Loading was controlled by hybridization with a major satellite DNA probe. (Right) Quantification of relative intensity in Dnmt3L−/− versus Dnmt3L+/+ testes (wild-type value set to 1). (C) Enrichment of the meiotic repair enzyme DMC1 over TE sequences by ChIP-qPCR. The β-actin promoter was used as a negative control for DMC1 enrichment. Error bars are as above. (D) Usage of canonical recombination hot spots. Five hot spots and one cold spot were assessed for H3K4me3 (top panel) and DMC1 (bottom panel) occupancy by ChIP-qPCR. Error bars are as above. (E) Estimation of total DSB numbers by end labeling of SPO11-associated ssDNA fragments. Immunoprecipitation was performed from whole-testis extracts of 18 dpp Dnmt3L+/+ and Dnmt3L−/− mice; a Spo11−/− adult mouse was used as a negative control. (Top) Autoradiograph of SPO11 oligocomplexes. (Arrow) Position of contaminating immunoglobulin heavy chains; (vertical line) SPO11 oligonucleotide signals ranging from 20 to 35 nt; (*) nonspecific terminal transferase labeling. (Middle) Quantification of SPO11 oligocomplex relative abundance in Dnmt3L−/− versus Dnmt3L+/+ testes (wild-type value set to 1). (Bottom) Anti-SPO11 Western blot. (F) Estimation of total DSB number by immunocytological detection of DMC1 foci. Representative images of double-immunofluorescence staining of SYCP3 (green) and DMC1 (red) on Dnmt3L+/+ and Dnmt3L−/− cells are presented. Bars, 10 µm. (G) DMC1 foci counting per zygotene spermatocyte in Dnmt3L+/+ and Dnmt3L−/− mice. Each dot is the count from a single cell. Box plots show the median and the first and third quartiles of the data, and whiskers show the maximum and minimum data points. One-hundred cells were analyzed per genotype (three mice per genotype).
Figure 5.
Figure 5.
Model for the dynamic role of DNA methylation and chromatin in controlling TEs before and at meiosis in males. (Top panels) Wild-type male germ cells. (Bottom panels) Dnmt3L−/− male cells. (Left) In wild-type spermatogonia, H3K9me2 and DNA methylation (5meC) are present at silent TEs. In DNA methylation (5meC)-deficient Dnmt3L−/− spermatogonia, H3K9me2 marks are maintained, and TEs are kept globally silent. (Middle) Upon meiosis onset, at the preleptotene/early leptotene stage, while the situation is unchanged in wild-type cells, the developmentally programmed loss of H3K9me2 occurs more precociously in Dnmt3L−/− cells. This exposes the DNA methylation deficiency at TE sequences and is coincident with their transcriptional activation and gain of active H3K4me3 marks. (Right) At the leptotene–zygotene stages of meiosis, the developmental loss of H3K9me2 is complete in wild-type cells, but DNA methylation maintains TE silent. At this stage, meiotic DSBs occur and are repaired mostly at H3K4me3-enriched recombination hot spots (pink areas). In Dnmt3L−/− meiotic cells, active H3K4me3-enriched TEs attract the recombination machinery. Consequently, some hot spots are depleted of H3K4me3 and meiotic DSBs. Cold spots (blue areas) are not affected.

References

    1. Anders S, Huber W. 2010. Differential expression analysis for sequence count data. Genome Biol 11: R106. - PMC - PubMed
    1. Anderson R, Schaible K, Heasman J, Wylie C. 1999. Expression of the homophilic adhesion molecule, Ep-CAM, in the mammalian germ line. J Reprod Fertil 116: 379–384. - PubMed
    1. Arand J, Spieler D, Karius T, Branco MR, Meilinger D, Meissner A, Jenuwein T, Xu G, Leonhardt H, Wolf V, et al. 2012. In vivo control of CpG and non-CpG DNA methylation by DNA methyltransferases. PLoS Genet 8: e1002750. - PMC - PubMed
    1. Aravin AA, Bourc'his D. 2008. Small RNA guides for de novo DNA methylation in mammalian germ cells. Genes Dev 22: 970–975. - PMC - PubMed
    1. Aravin AA, Sachidanandam R, Girard A, Fejes-Toth K, Hannon GJ. 2007. Developmentally regulated piRNA clusters implicate MILI in transposon control. Science 316: 744–747. - PubMed

Publication types

Associated data