Comparative Study
. 2015 Jun 25;16(1):133.
doi: 10.1186/s13059-015-0694-1.

Comparison of RNA-seq and microarray-based models for clinical endpoint prediction

Wenqian Zhang  1 Ying Yu  2 Falk Hertwig  3   4 Jean Thierry-Mieg  5 Wenwei Zhang  1 Danielle Thierry-Mieg  5 Jian Wang  6 Cesare Furlanello  7 Viswanath Devanarayan  8 Jie Cheng  9 Youping Deng  10 Barbara Hero  3 Huixiao Hong  11 Meiwen Jia  2 Li Li  12 Simon M Lin  13 Yuri Nikolsky  14 André Oberthuer  3 Tao Qing  2 Zhenqiang Su  11 Ruth Volland  3 Charles Wang  15 May D Wang  16 Junmei Ai  10 Davide Albanese  17 Shahab Asgharzadeh  18 Smadar Avigad  19 Wenjun Bao  12 Marina Bessarabova  14 Murray H Brilliant  20 Benedikt Brors  21 Marco Chierici  7 Tzu-Ming Chu  12 Jibin Zhang  1 Richard G Grundy  22 Min Max He  13 Scott Hebbring  20 Howard L Kaufman  10 Samir Lababidi  23 Lee J Lancashire  14 Yan Li  10 Xin X Lu  24 Heng Luo  11   25 Xiwen Ma  26 Baitang Ning  11 Rosa Noguera  27 Martin Peifer  4   28 John H Phan  16 Frederik Roels  3   4 Carolina Rosswog  3 Susan Shao  12 Jie Shen  11 Jessica Theissen  3 Gian Paolo Tonini  29 Jo Vandesompele  30 Po-Yen Wu  31 Wenzhong Xiao  32 Joshua Xu  11 Weihong Xu  33 Jiekun Xuan  11 Yong Yang  6 Zhan Ye  13 Zirui Dong  1 Ke K Zhang  34 Ye Yin  1 Chen Zhao  2 Yuanting Zheng  2 Russell D Wolfinger  12 Tieliu Shi  35 Linda H Malkas  36 Frank Berthold  3   4 Jun Wang  1   37   38   39 Weida Tong  11 Leming Shi  40   41 Zhiyu Peng  42   43 Matthias Fischer  44   45
Affiliations
Comparative Study

Comparison of RNA-seq and microarray-based models for clinical endpoint prediction

Wenqian Zhang et al. Genome Biol. .

Abstract

Background: Gene expression profiling is being widely applied in cancer research to identify biomarkers for clinical endpoint prediction. Since RNA-seq provides a powerful tool for transcriptome-based applications beyond the limitations of microarrays, we sought to systematically evaluate the performance of RNA-seq-based and microarray-based classifiers in this MAQC-III/SEQC study for clinical endpoint prediction using neuroblastoma as a model.

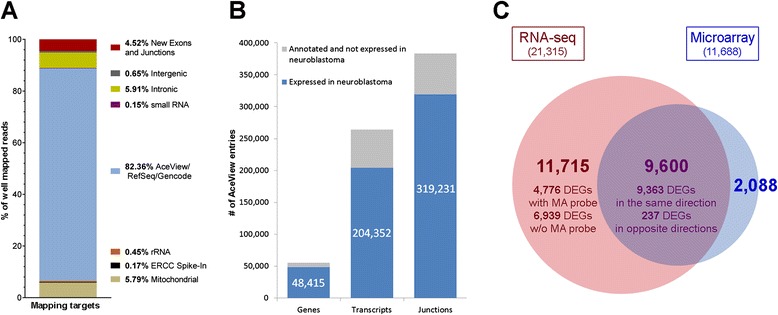
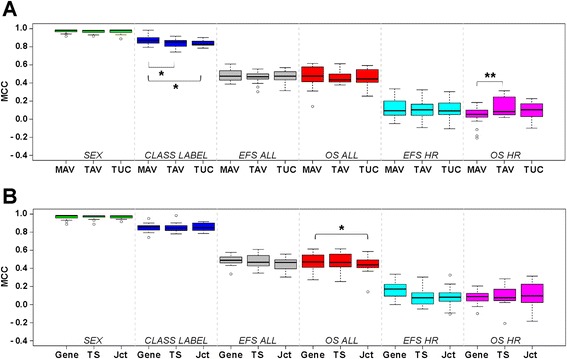
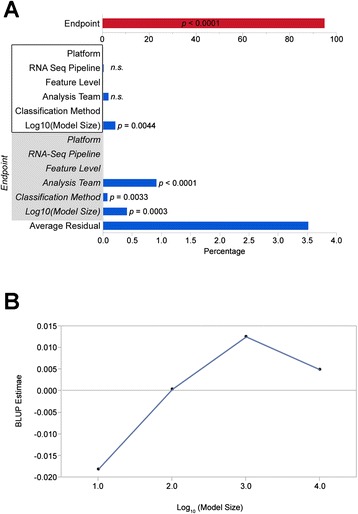
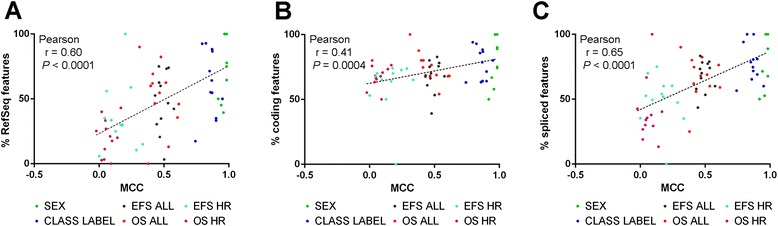
Results: We generate gene expression profiles from 498 primary neuroblastomas using both RNA-seq and 44 k microarrays. Characterization of the neuroblastoma transcriptome by RNA-seq reveals that more than 48,000 genes and 200,000 transcripts are being expressed in this malignancy. We also find that RNA-seq provides much more detailed information on specific transcript expression patterns in clinico-genetic neuroblastoma subgroups than microarrays. To systematically compare the power of RNA-seq and microarray-based models in predicting clinical endpoints, we divide the cohort randomly into training and validation sets and develop 360 predictive models on six clinical endpoints of varying predictability. Evaluation of factors potentially affecting model performances reveals that prediction accuracies are most strongly influenced by the nature of the clinical endpoint, whereas technological platforms (RNA-seq vs. microarrays), RNA-seq data analysis pipelines, and feature levels (gene vs. transcript vs. exon-junction level) do not significantly affect performances of the models.

Conclusions: We demonstrate that RNA-seq outperforms microarrays in determining the transcriptomic characteristics of cancer, while RNA-seq and microarray-based models perform similarly in clinical endpoint prediction. Our findings may be valuable to guide future studies on the development of gene expression-based predictive models and their implementation in clinical practice.


Figures

Fig. 1
Fig. 1
Characteristics of the neuroblastoma transcriptome according to RNA-seq data using the Magic-AceView pipeline. a Percentage of reads mapped to distinct targets. b Number of genes, transcripts, and exon-junctions expressed in the entire neuroblastoma cohort according to their annotation by AceView. c Absolute numbers and overlap of differentially expressed genes (DEGs) identified by RNA-seq (red) and microarrays (blue) in four disease subgroups (see main text)
Fig. 2
Fig. 2
Performances of RNA-seq- and microarray-based models to predict clinical endpoints in the validation cohorts. a Schematic overview of gene expression profiles generated by RNA-seq (n = 9 per sample) and microarray (n = 1 per sample). CL, Cufflinks; MAV, Magic-AceView; TAV, TopHat-AceView; TUC, TopHat-UCSC. b Distribution of MCC values of all models for each endpoint according to the technical platform (MA, microarray). Boxes indicate the 25 % and 75 % percentiles, and whiskers indicate the 5 % and 95 % percentiles; (*), P <0.05; two-sided T-test was performed for statistical testing. c, d Model performance of internal validation compared with external validation based on (c) microarray and (d) RNA-seq expression data in terms of MCC
Fig. 3
Fig. 3
Analysis of factors potentially affecting prediction performances of RNA-seq-based models. a Distribution of MCC values of all models for each endpoint according to RNA-seq data processing pipelines (MAV, Magic-AceView; TAV, TopHat-AceView; TUC, TopHat-UCSC). b Distribution of MCC values of all models for each endpoint according to feature levels, that is, gene, transcript (TS), and exon-junction (Jct) levels
Fig. 4
Fig. 4
a Contribution of different factors to the variability of prediction results as assessed by variance component analysis. (*), P <0.05; (**), P <0.01. The factors platform, RNA-seq pipeline, feature level, analysis team, classification method, and model size were analyzed both independently of the endpoint (white box), and taking a potential endpoint-dependence into account (gray box). b Best linear unbiased predictor (BLUP) estimates for the log10(model size) as the single factor contributing significantly to the prediction variability independent of the endpoint. Note that BLUPs are centered around zero and effectively average over all other effects. BLUPs for Log10(Model Size) indicate that models with 100 to 1,000 features perform better than those with fewer or more features
Fig. 5
Fig. 5
Correlation of prediction performances with the feature composition of prediction models. MCC values of MAV and TAV models were plotted against the fraction of RefSeq-annotated genes (a), the fraction of protein-coding genes (b), and the fraction of spliced genes (that is, genes or transcripts consisting of at least two exons; (c) in the model

References

    1. Beer DG, Kardia SL, Huang CC, Giordano TJ, Levin AM, Misek DE, et al. Gene-expression profiles predict survival of patients with lung adenocarcinoma. Nat Med. 2002;8:816–24. - PubMed
    1. Glas AM, Kersten MJ, Delahaye LJ, Witteveen AT, Kibbelaar RE, Velds A, et al. Gene expression profiling in follicular lymphoma to assess clinical aggressiveness and to guide the choice of treatment. Blood. 2005;105:301–7. doi: 10.1182/blood-2004-06-2298. - DOI - PubMed
    1. Glinsky GV, Glinskii AB, Stephenson AJ, Hoffman RM, Gerald WL. Gene expression profiling predicts clinical outcome of prostate cancer. J Clin Invest. 2004;113:913–23. doi: 10.1172/JCI20032. - DOI - PMC - PubMed
    1. Pomeroy SL, Tamayo P, Gaasenbeek M, Sturla LM, Angelo M, McLaughlin ME, et al. Prediction of central nervous system embryonal tumour outcome based on gene expression. Nature. 2002;415:436–42. doi: 10.1038/415436a. - DOI - PubMed
    1. Van’t Veer LJ, Dai H, Van de Vijver MJ, He YD, Hart AA, Mao M, et al. Gene expression profiling predicts clinical outcome of breast cancer. Nature. 2002;415:530–6. doi: 10.1038/415530a. - DOI - PubMed

Publication types