Clinical Trial
. 2015 Jun 24;7(293):293ra102.
doi: 10.1126/scitranslmed.aaa5079.

Epigenetic therapy overcomes treatment resistance in T cell prolymphocytic leukemia

Affiliations
Clinical Trial

Epigenetic therapy overcomes treatment resistance in T cell prolymphocytic leukemia

Zainul S Hasanali et al. Sci Transl Med. .

Abstract

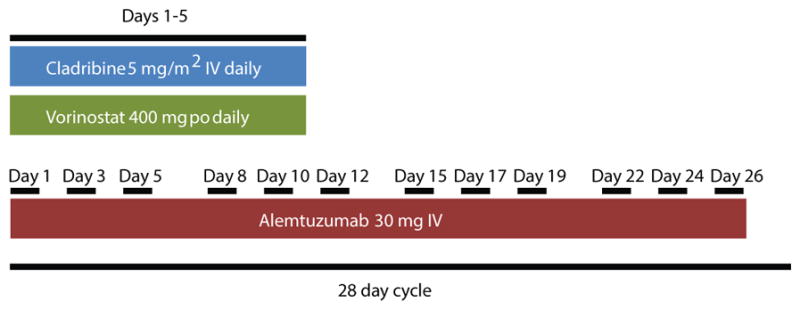
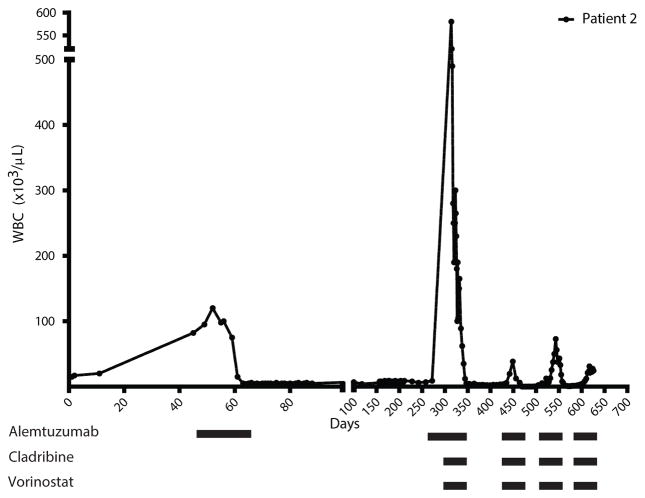
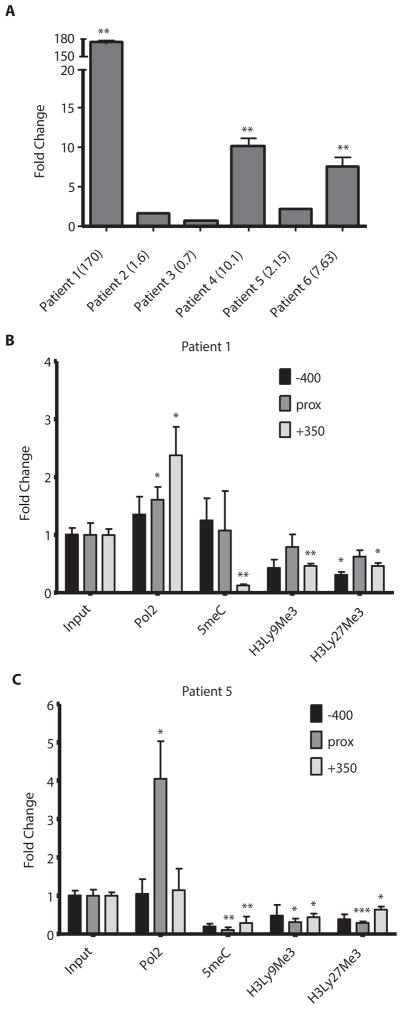
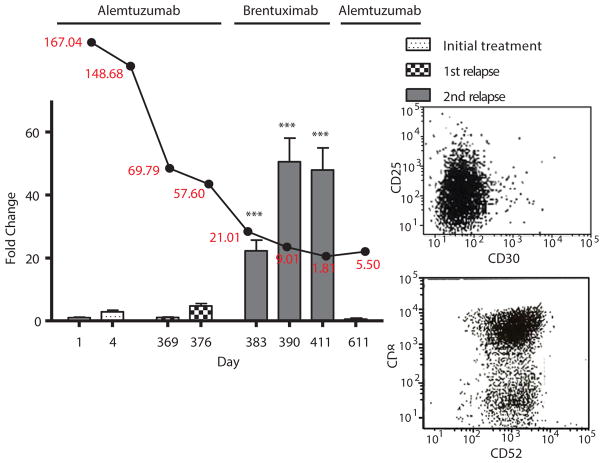
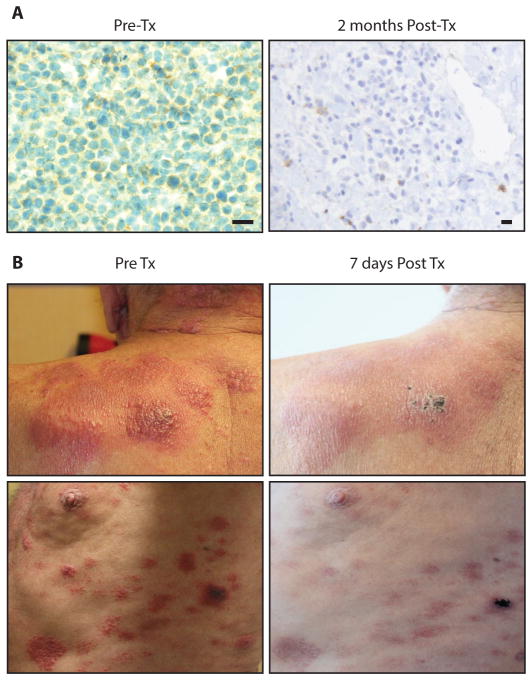
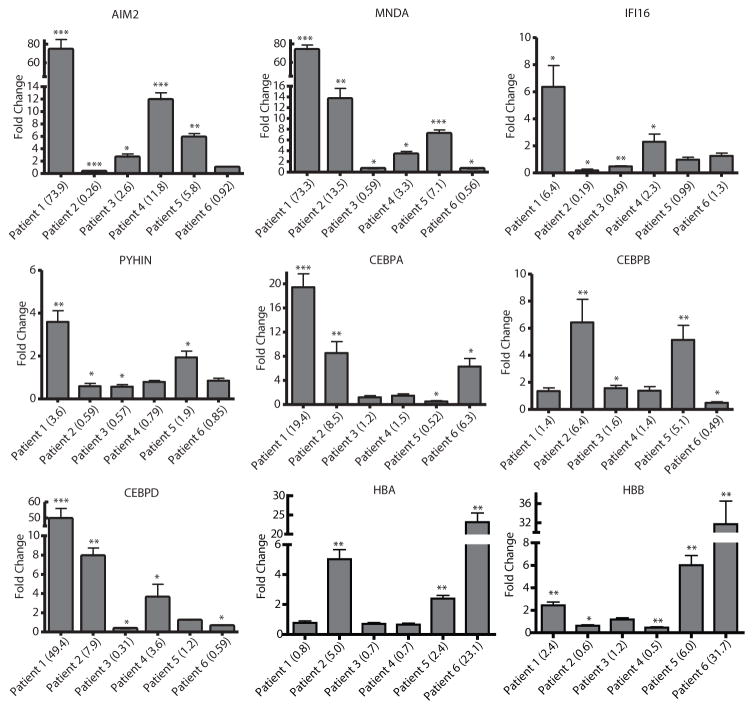
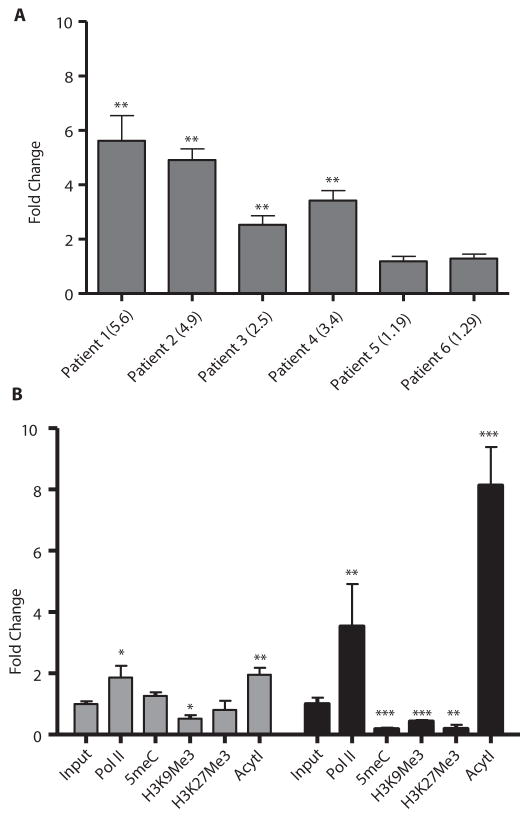
T cell prolymphocytic leukemia (T-PLL) is a rare, mature T cell neoplasm with distinct features and an aggressive clinical course. Early relapse and short overall survival are commonplace. Use of the monoclonal anti-CD52 antibody alemtuzumab has improved the rate of complete remission and duration of response to more than 50% and between 6 and 12 months, respectively. Despite this advance, without an allogeneic transplant, resistant relapse is inevitable. We report seven complete and one partial remission in eight patients receiving alemtuzumab and cladribine with or without a histone deacetylase inhibitor. These data show that administration of epigenetic agents can overcome alemtuzumab resistance. We also report epigenetically induced expression of the surface receptor protein CD30 in T-PLL. Subsequent treatment with the anti-CD30 antibody-drug conjugate brentuximab vedotin overcame organ-specific (skin) resistance to alemtuzumab. Our findings demonstrate activity of combination epigenetic and immunotherapy in the incurable illness T-PLL, particularly in the setting of previous alemtuzumab therapy.


Conflict of interest statement

Competing Interests: E.E. and K.S. Speakers Bureau Celgene; E.E. Speakers Bureau Seattle Genetics

Figures

Figure 1
Figure 1. Patient treatment protocol
Patients received cladribine at 5 mg/m2 intravenously each day on days 1–5. Those treated with vorinostat were given 400 mg orally each day on days 1–5 as well. Patients received alemtuzumab 30 mg intravenously once a day on days 1, 3, 5, 8, 12, 15, 17, 19, 22, 24 and 26. One treatment cycle was 28 days. All patients were treated with alemtuzumab and cladribine. Those whose white blood cell counts did not respond well after relapse were also treated with vorinostat. Status of clinical and molecular remissions was evaluated after 2–3 cycles.
Figure 2
Figure 2. Epigenetic therapy decreased leukemic white blood cell counts despite multiple relapses
Patient 2’s white blood cell counts were monitored during treatment. Day 0 was the initial white blood cell count at each respective presentation. The bars beneath the graph represent treatment received by the patient over the respective time periods. Graphs for all treated patients are available in Fig. S3.
Figure 3
Figure 3. Epigenetic therapy induced CD30 gene expression and chromatin reorganization
(A) Patient mRNA samples were assayed for CD30 gene expression using qRT-PCR before and 5 days after treatment with epigenetic therapy. Fold change represents the fold increase or decrease of expression after treatment relative to before treatment. Numbers in parentheses indicate actual fold change. Genomic DNA from patients 1 (B) and 5 (C) was assessed for changes in DNA and chromatin methylation as well as RNA polymerase II binding before and after treatment using ChIP assays. For patient 5, samples were taken before and 5 days post-treatment of relapse using romidepsin instead of vorinostat. For patient 1, samples were taken before and 5 days post-treatment of initial epigenetic treatment. Fold change indicates fold increase or decrease in binding after treatment as measured by qRT-PCR. Three regions of the CD30 promoter were considered in this assay spanning roughly 400 bp on each side of the transcription start site. Prox refers to a 200 bp region around the transcription start site. RNA polymerase II (Pol 2), 5-methylcytosine (5meC), histone 3 lysine 9 trimethylation (H3Ly9Me3), histone 3 lysine 27 trimethylation (H3Ly27Me3), * p<0.05, ** p<0.005, ***p<0.0005. Bars represent mean fold change +/− SEM. N=3.
Figure 4
Figure 4. CD30 positivity correlates with response to brentuximab vedotin in patient 5
For time points at which blood samples of patient 5 were available, CD30 status was assessed by qRT-PCR. This is represented by the bar graph with days on the x-axis. Values are reported as fold change compared to initial treatment naïve samples collected prior to study intervention. White blood cell counts (in red) from these same time points were also collected and graphed above their corresponding dates (black line graph). Antibody treatment received during each period is labeled above the graph. The inset to the right shows flow cytometry data of CD30 negative (top), CD52 positive (bottom) cell populations of the last time point at which CD30 expression was observed to disappear by qRT-PCR and subsequently treatment was switched back to alemtuzumab. ***p<0.0005. Bars represent mean fold change +/− SEM. N=3.
Figure 5
Figure 5. Brentuximab vedotin cleared CD30+ skin lesions in patient 5
(A) Immunohistochemistry of biopsies of these lesions showed CD30+ infiltrate (left) in the dermis before treatment with brentuximab vedotin and absent CD30+ T-PLL cells after 1 month of treatment (right). Nucleus (blue), CD30 (brown), scale bars are 20 μM (B) Images of the upper left shoulder (top) and lateral left chest wall (bottom) depict plaques infiltrated with CD30+ T-PLL cells before (left) and after (right) treatment with brentuximab vedotin.
Figure 6
Figure 6. Epigenetic therapy induces HIN-200, CEBP and globin gene expression
Changes in expression of AIM2, MNDA, IFI16, PYHIN, CEBPA, CEBPB, CEBPD, HBA and HBB were assessed by qRT-PCR before and 5 days after treatment of six patients with epigenetic therapy. Sufficient samples for mRNA analysis were only available for patients 1–6. Only the three unique CEBP family members were tested. Values are shown as fold changes as compared to treatment naïve levels of expression in each patient. Numbers in parentheses indicate actual fold change. * p<0.05, ** p<0.005, ***p<0.0005. Bars represent mean fold change +/− SEM. N=3.
Figure 7
Figure 7. Epigenetic therapy induces TRIB1 expression and results in increased active chromatin marks
(A) Changes in expression of TRIB1 were assessed by qRT-PCR before and after treatment of six patients with epigenetic therapy. Values are shown as fold changes as compared to treatment naïve levels of expression in each patient. Numbers in parentheses indicate actual fold change. (B) Genomic DNA from patients 1 (grey) and 5 (black) was assessed for changes in DNA and chromatin methylation as well as RNA polymerase II binding before and 5 days after treatment using ChIP, the same time point as fig. 3B and C. Fold change indicates fold increase or decrease in binding after treatment as measured by qRT-PCR. The region represented is 400bp around the transcriptional start of the TRIB1 gene. RNA polymerase II (Pol II), 5-methylcytosine (5meC), histone 3 lysine 9 trimethylation (H3K9Me3), histone 3 lysine 27 trimethylation (H3K27Me3) and Acytl (pan-histone acetylation), * p<0.05, ** p<0.005, ***p<0.0005. Bars represent mean fold change +/− SEM. N=3.

Comment in

References

    1. Robak T, Robak P. Current treatment options in prolymphocytic leukemia. Med Sci Monit. 2007;13:RA69–80. - PubMed
    1. Dearden CE. T-cell prolymphocytic leukemia. Med Oncol. 2006;23:17–22. - PubMed
    1. Matutes E, Brito-Babapulle V, Swansbury J, Ellis J, Morilla R, Dearden C, Sempere A, Catovsky D. Clinical and laboratory features of 78 cases of T-prolymphocytic leukemia. Blood. 1991;78:3269–3274. - PubMed
    1. Pawson R, Schulz TF, Matutes E, Catovsky D. The human T-cell lymphotropic viruses types I/II are not involved in T prolymphocytic leukemia and large granular lymphocytic leukemia. Leukemia. 1997;11:1305–1311. - PubMed
    1. Dearden C. How I treat prolymphocytic leukemia. Blood. 2012;120:538–551. - PubMed

Publication types

MeSH terms

Associated data