Intrinsic properties of germinal center-derived B cells promote their enhanced class switching to IgE
- PMID: 26109279
- PMCID: PMC4744720
- DOI: 10.1111/all.12679
Intrinsic properties of germinal center-derived B cells promote their enhanced class switching to IgE
Abstract
Background: Research on the origins and development of human IgE-expressing (IgE(+) ) cells is required for understanding the pathogenesis of allergy and asthma. These studies have been thwarted by the rarity of IgE(+) cells in vivo and the low frequency of class switch recombination (CSR) to IgE ex vivo. To determine the main source of IgE(+) cells, we investigated the relation between the phenotypic composition of tonsil B cells and the CSR to IgE ex vivo.
Methods: Human tonsil B cells were analyzed by flow cytometry (FACS) and cultured with IL-4 and anti-CD40 to induce CSR to IgE. Naïve, germinal center (GC), early GC (eGC), and memory tonsil B cells were isolated by FACS, and their capacities for IL-4 and anti-CD40 signaling, cell proliferation, and de novo class switching to IgE were analyzed by RT-PCR and FACS.
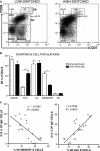
Results: B cells from different tonsils exhibited varying capacities for CSR to IgE ex vivo. This was correlated with the percentage of eGC B cells in the tonsil at the outset of the culture. Despite relatively poor cell viability, eGC and GC B-cell cultures produced the highest yields of IgE(+) cells compared to naïve and memory B-cell cultures. The main factors accounting for this result were the strength of IL-4R and CD40 signaling and relative rates of cell proliferation.
Conclusions: This study shows that the maturation state of tonsil B cells determines their capacity to undergo class switching to IgE ex vivo, with the GC-derived B cells yielding the highest percentage of IgE(+) cells.
Keywords: IgE class switching; allergy; germinal center; human B cells.
© 2015 The Authors. Allergy Published by John Wiley & Sons Ltd.
Figures


Similar articles
-
Engagement of CD153 (CD30 ligand) by CD30+ T cells inhibits class switch DNA recombination and antibody production in human IgD+ IgM+ B cells.J Immunol. 2000 Jul 15;165(2):786-94. doi: 10.4049/jimmunol.165.2.786. J Immunol. 2000. PMID: 10878352 Free PMC article.
-
CD40 ligand and appropriate cytokines induce switching to IgG, IgA, and IgE and coordinated germinal center and plasmacytoid phenotypic differentiation in a human monoclonal IgM+IgD+ B cell line.J Immunol. 1998 Mar 1;160(5):2145-57. J Immunol. 1998. PMID: 9498752 Free PMC article.
-
Ontogeny of human IgE-expressing B cells and plasma cells.Allergy. 2017 Jan;72(1):66-76. doi: 10.1111/all.12911. Epub 2016 Jun 8. Allergy. 2017. PMID: 27061189 Free PMC article.
-
Control of memory B cell responses by extrinsic and intrinsic mechanisms.Immunol Lett. 2016 Oct;178:27-30. doi: 10.1016/j.imlet.2016.05.010. Epub 2016 Jun 23. Immunol Lett. 2016. PMID: 27345519 Review.
-
Features of B Cell Responses Relevant to Allergic Disease.J Immunol. 2022 Jan 15;208(2):257-266. doi: 10.4049/jimmunol.2100988. J Immunol. 2022. PMID: 35017215 Free PMC article. Review.
Cited by
-
IgE repertoire and immunological memory: compartmental regulation and antibody function.Int Immunol. 2018 Aug 30;30(9):403-412. doi: 10.1093/intimm/dxy048. Int Immunol. 2018. PMID: 30053010 Free PMC article. Review.
-
Early IgE Production Is Linked with Extrafollicular B- and T-Cell Activation in Low-Dose Allergy Model.Vaccines (Basel). 2022 Jun 17;10(6):969. doi: 10.3390/vaccines10060969. Vaccines (Basel). 2022. PMID: 35746576 Free PMC article.
-
Global gene regulation during activation of immunoglobulin class switching in human B cells.Sci Rep. 2016 Nov 29;6:37988. doi: 10.1038/srep37988. Sci Rep. 2016. PMID: 27897229 Free PMC article.
-
IgE+ plasmablasts predict the onset of clinical allergy.Front Immunol. 2023 Feb 2;14:1104609. doi: 10.3389/fimmu.2023.1104609. eCollection 2023. Front Immunol. 2023. PMID: 36817463 Free PMC article.
-
Gut Mucosal Antibody Responses and Implications for Food Allergy.Front Immunol. 2018 Sep 27;9:2221. doi: 10.3389/fimmu.2018.02221. eCollection 2018. Front Immunol. 2018. PMID: 30319658 Free PMC article. Review.
References
-
- Humbert M, Busse W, Hanania NA, Lowe PJ, Canvin J, Erpenbeck VJ et al. Omalizumab in asthma: an update on recent developments. J Allergy Clin Immunol Pract 2014;2:525–536. - PubMed
-
- Gould HJ, Sutton BJ. IgE in allergy and asthma today. Nat Rev Immunol 2008;8:205–217. - PubMed
-
- Gould HJ, Ramadani F. IgE responses in mouse and man and the persistence of IgE memory. Trends Immunol 2015;36:40–48. - PubMed
-
- Dullaers M, De Bruyne R, Ramadani F, Gould HJ, Gevaert P, Lambrecht BN. The who, where, and when of IgE in allergic airway disease. J Allergy Clin Immunol 2012;129:635–645. - PubMed
-
- Geha RS, Jabara HH, Brodeur SR. The regulation of immunoglobulin E class‐switch recombination. Nat Rev Immunol 2003;3:721–732. - PubMed
Publication types
MeSH terms
Substances
Grants and funding
LinkOut - more resources
Full Text Sources
Other Literature Sources
Research Materials
Miscellaneous

