. 2016 Feb;27(2):495-508.
doi: 10.1681/ASN.2014111108. Epub 2015 Jun 24.

Retinoic Acid Signaling Coordinates Macrophage-Dependent Injury and Repair after AKI

Affiliations

Retinoic Acid Signaling Coordinates Macrophage-Dependent Injury and Repair after AKI

Takuto Chiba et al. J Am Soc Nephrol. 2016 Feb.

Abstract

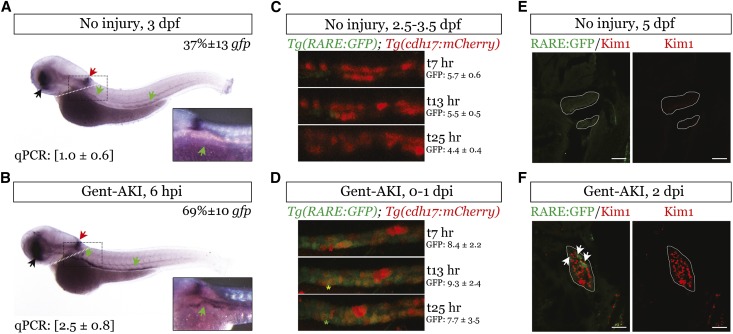
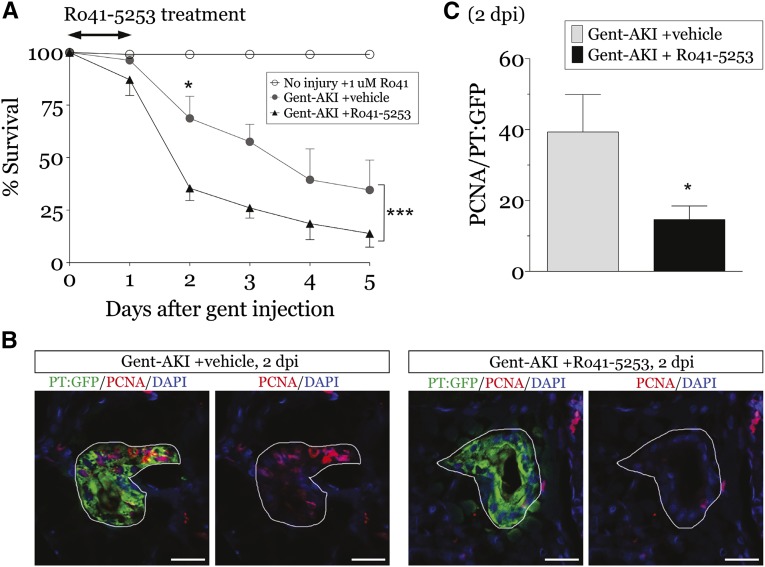
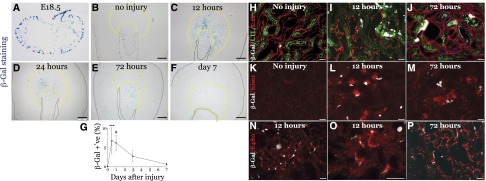
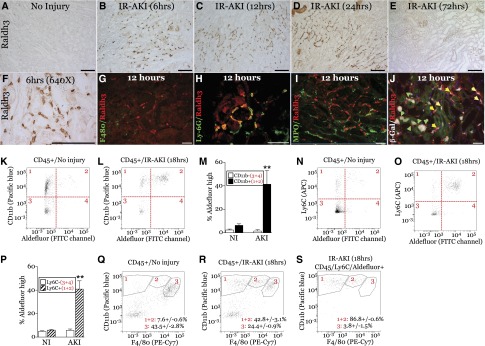
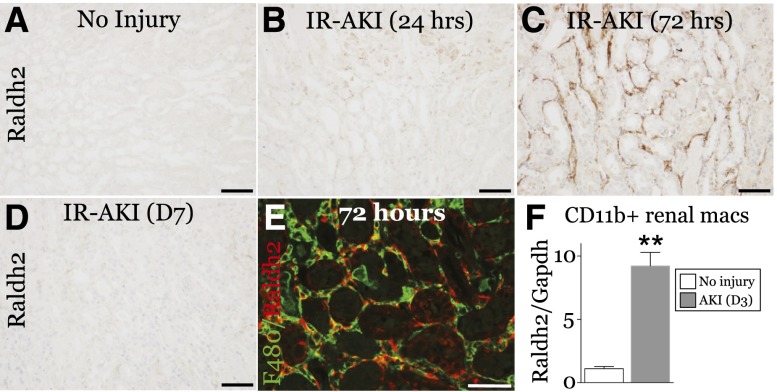
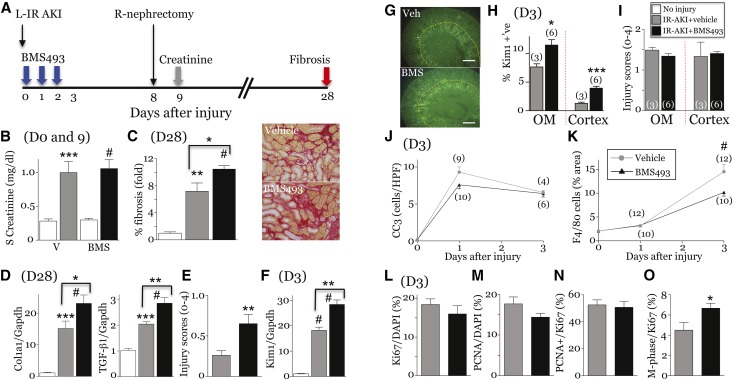
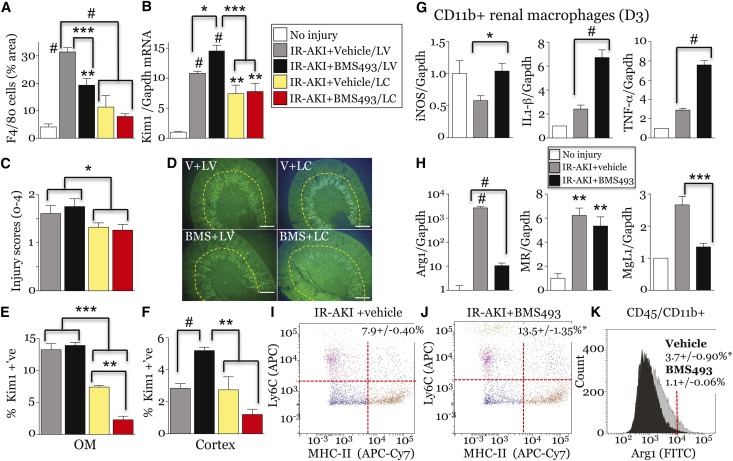
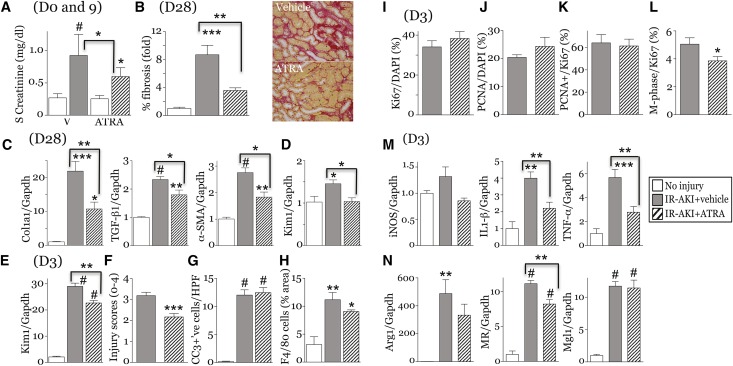
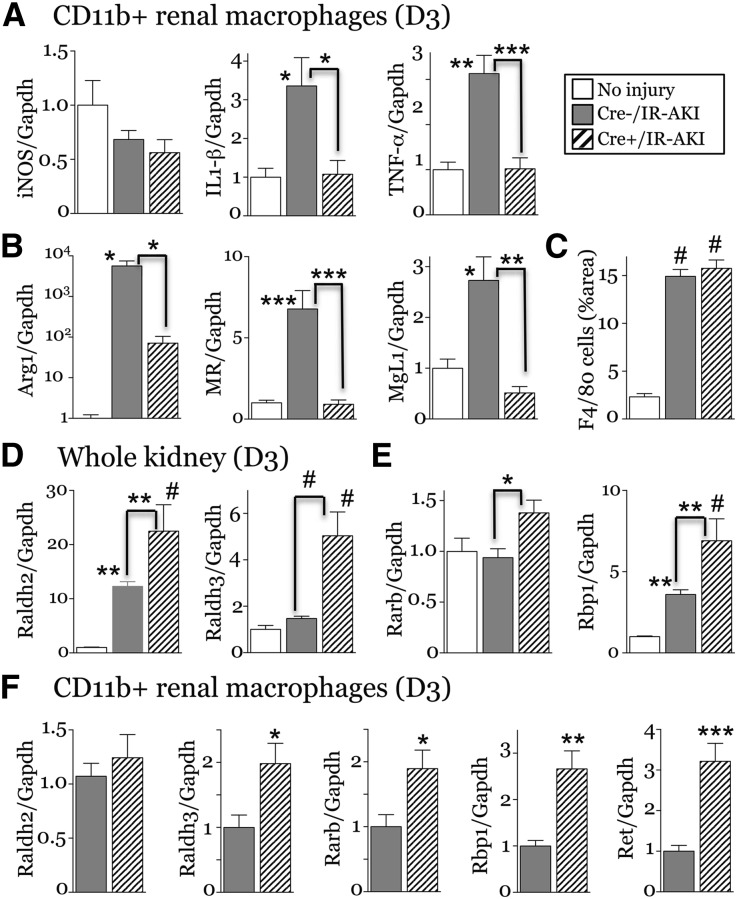
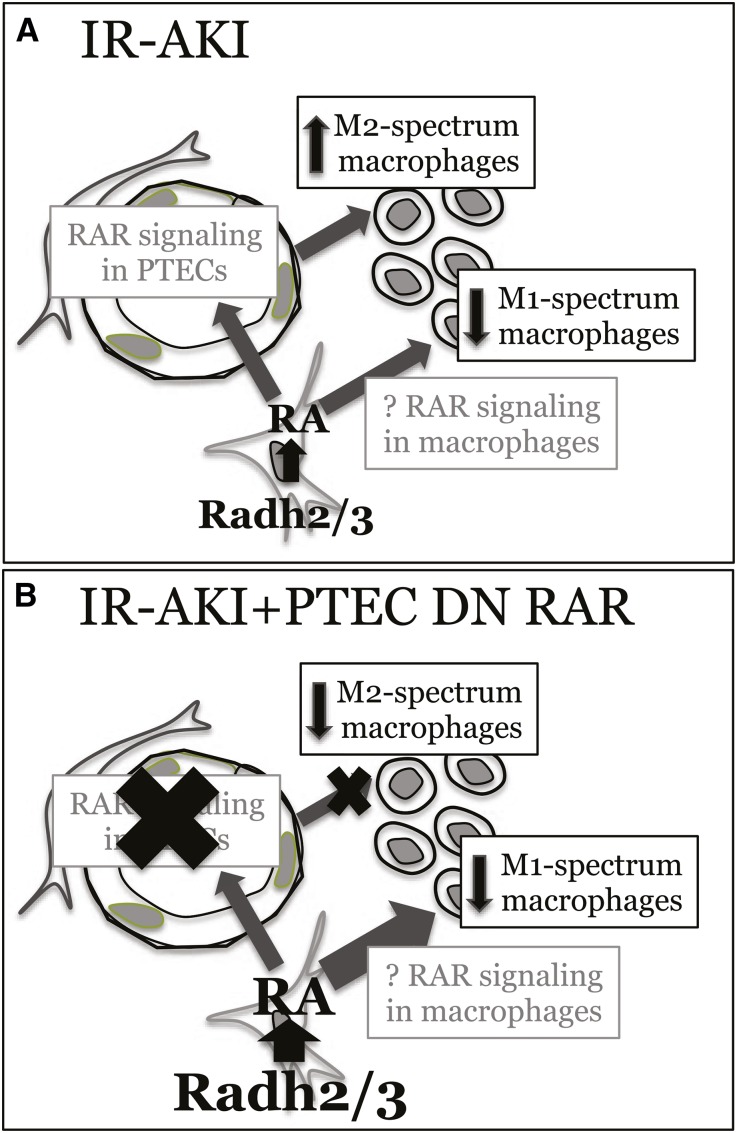
Retinoic acid (RA) has been used therapeutically to reduce injury and fibrosis in models of AKI, but little is known about the regulation of this pathway and what role it has in regulating injury and repair after AKI. In these studies, we show that RA signaling is activated in mouse and zebrafish models of AKI, and that these responses limit the extent of injury and promote normal repair. These effects were mediated through a novel mechanism by which RA signaling coordinated the dynamic equilibrium of inflammatory M1 spectrum versus alternatively activated M2 spectrum macrophages. Our data suggest that locally synthesized RA represses proinflammatory macrophages, thereby reducing macrophage-dependent injury post-AKI, and activates RA signaling in injured tubular epithelium, which in turn promotes alternatively activated M2 spectrum macrophages. Because RA signaling has an essential role in kidney development but is repressed in the adult, these findings provide evidence of an embryonic signaling pathway that is reactivated after AKI and involved in reducing injury and enhancing repair.

Keywords: acute renal failure; macrophages; renal injury; renal proximal tubule cell; signaling; tubular epithelium.


Figures

Figure 1.
Figure 1.
RA signaling is increased in zebrafish larval kidneys after AKI. We injected Tg(12XRARE:EGFP) zebrafish larvae with 8 ng of gentamicin at 2.5 or 3 dpf to induce renal injury. (A and B) Whole-mount in situ hybridization comparing gfp mRNA expression in larvae injected with gentamicin (gent-AKI) and uninjured controls 6 hpi. Colored arrows show domains of expression: retina (black), anterior spinal cord (red), and kidney (green). Original magnification, ×2.5. Inset: Higher magnification of the proximal tubule in the boxed region. Percent gfp quantifies the number of fish with strong, pan-renal expression (n=3 experiments at 3 dpf, ≥12 larvae/group, mean±SEM). qRT-PCR gfp mRNA expression for dissected trunk tissue posterior to the white dotted line are in brackets below the in situ image, mean fold change±SEM (n=3 experiments, 15 larvae/group). Normalized to β-actin and SDHA. (C and D) Single images from live time-lapse multi-photon imaging showing a region of the proximal tubule of Tg(12XRARE:GFP); Tg(cdh17:mCherry) double transgenic fish. Imaging was performed for 21 hours beginning at 4 hours after gentamicin injection. Red indicates Cdh17-positive, differentiated renal epithelial cells (example, red asterisk), green indicates RA reporter–positive cells (example, green asterisk), and yellow indicates double-positive cells (example, yellow asterisk). Original magnification, ×25. GFP values indicate average fluorescence intensity±SEM for the image stack at the indicated time point (n=10 uninjured and 6 gent-AKI nephrons). (E and F) Immunofluorescence staining for Kim1 (red) and GFP (green) in the kidney of Tg(12XRARE:GFP) fish at 2 dpi. Examples of co-localization are indicated by white arrows. Tubules are outlined in white. Scale bars, 20 µm. hpi, hours after injury.
Figure 2.
Figure 2.
Blocking RA pathway activation exacerbates AKI in zebrafish larvae. Zebrafish larvae were injected with 8 ng gentamicin at 3 dpf to induce renal injury, followed by treatment with vehicle (1% DMSO) or 1 µM Ro41–5253 for 24 hours. (A) Uninjured or gent-AKI larvae were treated with Ro41–5253 and their survival assessed daily through 5 dpi (n=4 experiments, ≥25 larvae/group). Two-way ANOVA, ***P<0.001. Bonferroni’s correction for multiple comparisons between vehicle and Ro41–5253-treated larvae at the same time points: *P<0.05. (B and C) Immunofluorescence for PCNA (red) and GFP (green) in the proximal tubule of Tg(PT:EGFP) fish at 2 dpi. PCNA-positive cells were quantified in the proximal tubule by examining serial sections (n=5 larvae/group). Data expressed as mean+SEM. Two-tailed t test, *P<0.05. Tubules are outlined in white. Scale bars, 20 µm.
Figure 3.
Figure 3.
RA signaling is activated in the kidney after IR-AKI in mice. Unilateral IR-AKI was performed in male RARE-hsp68-lacZ reporter mice. (A–F) RARE-dependent β-Gal activity in (A) E18.5 embryonic kidney, (B) uninjured kidneys, and injured kidneys at (C) 12, (D) 24, (E) 72 hours, and (F) day 7 after injury, as indicated. Yellow dotted lines demarcate limits of the OM. (G) Quantification of RARE-hsp68-lacZ reporter activity time course after injury. Percent β-Gal–positive area in the OM: uninjured mice (n=12), 12 hours (n=9), 24 hours (n=13), 72 hours (n=8) and day 7 (n=11) after injury. Kruskal–Wallis one-way ANOVA (P<0.001) using Dunn’s test for multiple comparisons with uninjured controls: ***P<0.001, #P<0.001. (H–P) Cellular localization of β-Gal activity in RARE-hsp68-lacZ reporter kidneys after IR-AKI. β-Gal is pseudocolored in white, other markers as indicated. Timing after injury, as indicated. (H and J) Proximal tubular cell marker, lotus tetraglonolobus lectin (green) and Collagen IV (red). (K–M) Proximal tubular cell injury marker, Kim1 (red). (N and P) Macrophage/dendritic cell marker F4/80 (red). Black scale bars, 500 µm; white bars, 50 µm.
Figure 4.
Figure 4.
Raldh3 is expressed at sites of RA signaling at early time points after IR-AKI. Unilateral IR-AKI was performed in wild-type BALB/c or RARE-hsp68-LacZ mice, and kidneys harvested at the indicated times after injury. (A–F) Localization of Raldh3 expression in the OM at 0, 6, 12, 24, and 72 hours in the OM after IR-AKI. Kidney sections stained with anti-Raldh3 antibody, detected using horse radish peroxidase/3,3ʹ-diaminobenzidine substrate, counterstained with hematoxylin. (A–E) Original magnification, ×200. (F) Original magnification, ×640. (G–J) Cellular localization of Raldh3 in the OM after IR-AKI. Co-staining Raldh3 (red) with (G) macrophage/dendritic cells marker, F4/80 (green), (H) neutrophil and early infiltrating macrophage marker, Ly-6G (green), and (I) neutrophil marker, myeloperoxidase (green). (J) Co-localization of Raldh3 expression and RA signaling 12 hours after IR-AKI. β-Gal activity was detected in RARE-hsp68-LacZ reporter mice, and sections stained with Raldh3 antibodies (red). β-Gal pseudocolored in white, green autofluorescence shows renal tubular structures. Green arrows indicate Raldh3-positive cells surrounding β-Gal–positive renal tubular cells; yellow arrows indicate Raldh3-expressing cells that are also β-Gal–positive. White scale bars, 50 mm, black bars, 100 mm. (K–S) FACS analysis of ALDH activity in CD45+ renal leukocytes using the ALDEFLUOR reagent. (K–M) CD11b and ALDEFLUOR fluorescence in uninjured and injured kidney. (K and L) Representative dot plots indicating CD11b and ALDEFLUOR high and low quadrant gates. (M) Quantification of ALDEFLUOR high CD11b + and – cells. (N–P) Ly6C and ALDEFLUOR fluorescence in uninjured and injured kidney. (N and O) Representative dot plots indicating Ly6C and ALDEFLUOR high and low quadrant gates. (P) Quantification of ALDEFLUOR high Ly6C + and – cells. (Q and R) Representative dot plots of F4/80 and CD11b fluorescence in uninjured and injured kidneys. Gating for F4/80- (1), F4/80 low (2) and F4/80 high (3) indicated and quantified. (S) Representative dot plots of F4/80 and CD11b fluorescence in Ly6C/ALDEFLUOR high cells (gate 2 in O) in injured kidneys. Results expressed as mean±SEM % of total gated cells (CD45+ or CD45/Ly6C/ALDEFLUOR high cells, as indicated). n=3 mice per condition. (N and Q) t Test comparing CD11b+ or Ly6C+ cells from uninjured versus injured kidneys, **P<0.01.
Figure 5.
Figure 5.
Raldh2 is expressed at sites of RA-signaling activity 72 hours after IR-AKI. Unilateral IR-AKI was performed in wild-type BALB/c mice, and kidneys harvested at the indicated times after injury. (A–D) Localization of Raldh2 expression at 0, 24, 72 hours, and 7 days after IR-AKI, as indicated. Kidney sections stained with anti-Raldh2 antibody, detected using horse radish peroxidase/3,3ʹ-diaminobenzidine substrate, counterstained with hematoxylin. (E) Co-localization of Raldh2 (red) with F4/80-positive macrophages (green) in the OM 72 hours after IR-AKI. White scale bar, 50 µm; black bars, 100 µm. (F) Expression of Raldh2 mRNA in renal macrophages 72 hours after IR-AKI. qRT-PCR for Raldh2 mRNA relative to Gapdh control mRNA was performed on RNA extracted from renal macrophages isolated using magnetic beads coated with anti-CD11b antibodies: uninjured mice (n=3), and mice 3 days after injury (n=8). Results expressed as mean±SEM fold change relative to uninjured controls. Two-tailed t test, **P<0.01 versus uninjured controls.
Figure 6.
Figure 6.
Early inhibition of RA signaling exacerbates postinjury fibrosis after IR-AKI. (A) Schematic of the experiment. Studies performed in uninjured controls (n=3–6), vehicle- (n=4–8) and BMS493-treated (n=6–10) mice at day 3, and vehicle- (n=7–12) and BMS493-treated (n=7–10) mice day 28 post-AKI unless indicated in the figure. (B) Serum creatinines days 0 and 9 post-AKI. (C) Renal fibrosis day 28 after injury. Percent fibrosis in the OM. Images showing SR staining. (D) Expression of fibrosis markers. qRT-PCR for collagen 1a1 chain (Col1a1) and TGF-β1 mRNAs relative to Gapdh day 28 post-AKI. (E) Chronic tubular injury scores (OM). Injury scores at day 28. t Test: **P<0.01. (F–I) Early tubular injury after IR-AKI. (F) Tubular injury marker, Kim1 mRNA, at day 3. (G and H) Kim1 localization 3 days after IR-AKI. (G) Representative images showing Kim1 expression. Yellow dotted lines demarcate the OM. (H) Quantification of Kim1 in the OM and cortex. t Test, *P<0.05; ***P<0.001. (I) Acute tubular injury scores. Injury scores in the OM and cortex at day 3. t Test: NS. (J) Tubular apoptosis. Cleaved caspase-3–positive cells/HPF. Two-way ANOVA: NS treatment effect. (K) Renal macrophages. Surface area of F4/80 macrophages. Two-way ANOVA: P<0.01, vehicle versus BMS493: #P<0.001. (L–O) Tubular proliferation at day 3 (OM). t Test, *P<0.05. Results expressed as mean±SEM. (C, D, and F) Fold change relative to uninjured controls. One-way ANOVA for B–D, and F, results indicated if one-way ANOVA: P≤0.05; *P<0.05; **P<0.01; ***P<0.001; #P<0.001. Comparison with uninjured controls (no brackets), or vehicle- and BMS493-treated mice (brackets).
Figure 7.
Figure 7.
BMS493 increases macrophage-dependent tubular injury and deregulates macrophage polarization after IR-AKI. (A–E) Macrophage depletion prevents BMS493-dependent renal injury after IR-AKI. Unilateral IR-AKI was performed in mice pretreated with LC, or LV, and randomized to receive BMS493 (BMS+LV, n=9; BMS+LC, n=6), or vehicle (V+LV, n=10; V+LC, n=4), 1 hour after injury. Kidneys harvested on day 3. (A) LC depletes renal macrophages after IR-AKI. Surface area of F4/80 macrophages. (B) Tubular injury marker, Kim1 mRNA. qRT-PCR for Kim1/Gapdh control mRNAs. (C) Acute tubular injury scores at day 3. t Test was used to compare IR-AKI with LV and LC data: *P<0.05. (D–F) Kim 1 localization. (D) Representative image showing Kim1 expression. (E,F) Quantification of Kim1 in the OM and cortex. (G and H) BMS493 increases M1 and decreases M2 macrophage marker expression at day 3. qRT-PCR for M1 (G) and M2 marker (H) relative to Gapdh control mRNA in renal macrophages from uninjured (n=1 for IL-1β, TNF-α and MgL1, n=3 for iNOS, Arg1 and MR mRNAs) and vehicle- (n=7–8) and BMS493-treated (n=8) kidneys 3 days after injury. All results are expressed as mean±SEM. (B, G and H) Fold change relative to controls. For analysis of I–K, IL-1β, TNF-α and MgL1 mRNAs we used a t test to compare vehicle versus BMS493: *P<0.05; ***P<0.001; #P<0.001. One-way ANOVA was used for all other studies and results only indicated if ANOVA P≤0.05: *P<0.05; **P<0.01; ***P<0.001; #P<0.001 versus uninjured control mice (no brackets), or vehicle versus BMS493 mice (brackets). (I–K) FACS analysis of CD45+/CD11b+ renal macrophages isolated 3 days after injury from vehicle- or BMS493-treated mice, n=3/group. (I and J) Ly6C and MHC-II antigen expression. Percent Ly6C/MHC-II high indicated. (K) Intracellular Arg1 expression. percent Arg1-FITC high indicated (>104 FU). t Test comparing vehicle versus BMS493 treatment groups (I versus J, and K): *P<0.05. LV, liposome vehicle.
Figure 8.
Figure 8.
ATRA attenuates injury and fibrosis after IR-AKI. Unilateral IR-AKI performed on male BALB/c mice with contralateral nephrectomy at day 8. Daily treatment with vehicle or ATRA started 24 hpi for 7 days. Kidneys harvested at days 3 and 28. Uninjured controls (n=3–4), vehicle- (n=7–9) and ATRA-treated (n=7–8) at day 3, and vehicle- (n=6–7) and ATRA-treated (n=7) kidneys day 28. (A) Serum creatinine 0 and 9 days post-AKI. (B and C) Renal fibrosis at day 28. (B) Percent fibrosis in the OM. Images showing SR staining. (C) Expression of fibrosis markers. qRT-PCR for Col1a1, TGF-β1 and α-smooth muscle actin (α-SMA) relative to Gapdh mRNA at day 28. (D) Tubular injury marker, Kim1 mRNA 28 days post-AKI. qRT-PCR for Kim1/Gapdh control mRNAs. (E–G) Early tubular injury after IR-AKI. (E) Kim1 mRNA at day 3. (F) Tubular injury scores (OM) at day 3. (G) Tubular apoptosis. Cleaved caspase-3–positive cells/HPF at day 3. (H) Renal macrophages. Surface area of F4/80 macrophages. (I–L) Tubular proliferation at day 3 (OM). t Test, *P<0.05. (M,N) ATRA decreases M1 macrophage marker expression at day 3. qRT-PCR for (M) M1 and (N) M2 markers relative to Gapdh control mRNAs. Results expressed as mean±SEM. qRT-PCR and fibrosis data (B) expressed as fold change relative to controls. Unless otherwise indicated, one-way ANOVA performed. Results only indicated if ANOVA P<0.05: *P<0.05; **P<0.01; ***P<0.001; #P<0.001. Comparison with uninjured controls (no brackets), or vehicle- and ATRA-treated mice (brackets). hpi, hours after injury.
Figure 9.
Figure 9.
Genetic inhibition of RA signaling in PTECs inhibits M2 macrophage switching after IR-AKI. Male PEPCK-Cre/+;R26R-RaraDN+/+ (Cre+ PTEC DN RAR) and PEPCK-Cre/–; R26R-RaraDN+/+ (Cre– PTEC DN RAR) mice underwent left renal pedicle clamping and kidneys harvested 3 days after injury. Studies were performed in Cre– (n=8–10) and Cre+ (n=4–5) mice post-AKI, and uninjured controls (itemized below). (A, B) M1 and M2 markers in renal macrophages. qRT-PCR for (A) M1 and (B) M2 macrophage markers relative to Gapdh mRNA control was performed on renal macrophages isolated using CD11b antibody–coated magnetic beads. We saw no differences between uninjured Cre– and Cre+ controls, so both control groups were combined for these studies (n=2+3). (C) Renal macrophage numbers, surface area of F4/80-stained macrophages day 3 after injury. Cre– uninjured controls (n=3). (D, E) PTEC-DN-RAR mice have increased expression of RA-synthesizing enzymes and RA-responsive genes after IR-AKI. qRT-PCR for (D) the RA-synthesizing enzymes Raldh2 and Raldh3, and (E) RA target genes Rarb and Rbp1 performed on kidneys 3 dpi. Cre– uninjured controls (n=5). One-way ANOVA with Tukey’s correction for multiple between-group comparisons. Results only indicated if one-way ANOVA P<0.05: *P<0.05; **P<0.01; #P<0.001. Comparison with uninjured controls (no brackets), or between Cre+ uninjured, Cre– and Cre+ injured mice (indicated by brackets). (F) Expression of RA-synthesizing enzymes and RA-responsive genes in renal macrophages from PTEC-DN-RAR mice after IR-AKI (n=6/group). t Test: *P<0.05; **P<0.01. All results expressed as mean±SEM, (A, B, D, and E) fold change versus uninjured controls, (F) fold change relative to Cre– injured mouse kidneys.
Figure 10.
Figure 10.
Proposed model by which (A) RA signaling regulates renal macrophage phenotypes after IR-AKI, and (B) how manipulation of RA signaling in PTEC-DNRAR mice regulates the balance of M1 and M2 spectrum macrophages in these studies.

References

    1. Rosselot C, Spraggon L, Chia I, Batourina E, Riccio P, Lu B, Niederreither K, Dolle P, Duester G, Chambon P, Costantini F, Gilbert T, Molotkov A, Mendelsohn C: Non-cell-autonomous retinoid signaling is crucial for renal development. Development 137: 283–292, 2010 - PMC - PubMed
    1. Batourina E, Gim S, Bello N, Shy M, Clagett-Dame M, Srinivas S, Costantini F, Mendelsohn C: Vitamin A controls epithelial/mesenchymal interactions through Ret expression. Nat Genet 27: 74–78, 2001 - PubMed
    1. Maden M: Retinoic acid and limb regeneration—a personal view. Int J Dev Biol 46: 883–886, 2002 - PubMed
    1. Maden M: The effect of vitamin A on the regenerating axolotl limb. J Embryol Exp Morphol 77: 273–295, 1983 - PubMed
    1. Kikuchi K, Holdway JE, Major RJ, Blum N, Dahn RD, Begemann G, Poss KD: Retinoic acid production by endocardium and epicardium is an injury response essential for zebrafish heart regeneration. Dev Cell 20: 397–404, 2011 - PMC - PubMed

Publication types

LinkOut - more resources