. 2015 Jun 25:6:7526.
doi: 10.1038/ncomms8526.

Cell migration and antigen capture are antagonistic processes coupled by myosin II in dendritic cells

Affiliations

Cell migration and antigen capture are antagonistic processes coupled by myosin II in dendritic cells

Mélanie Chabaud et al. Nat Commun. .

Erratum in

Abstract

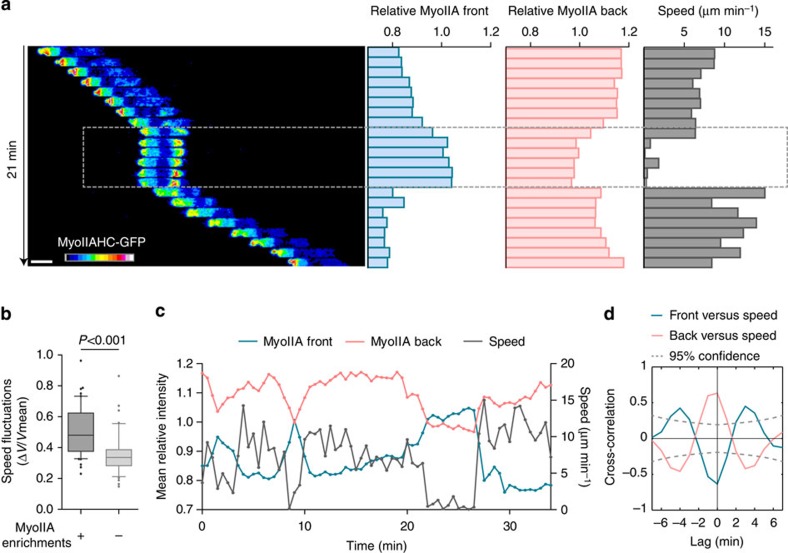
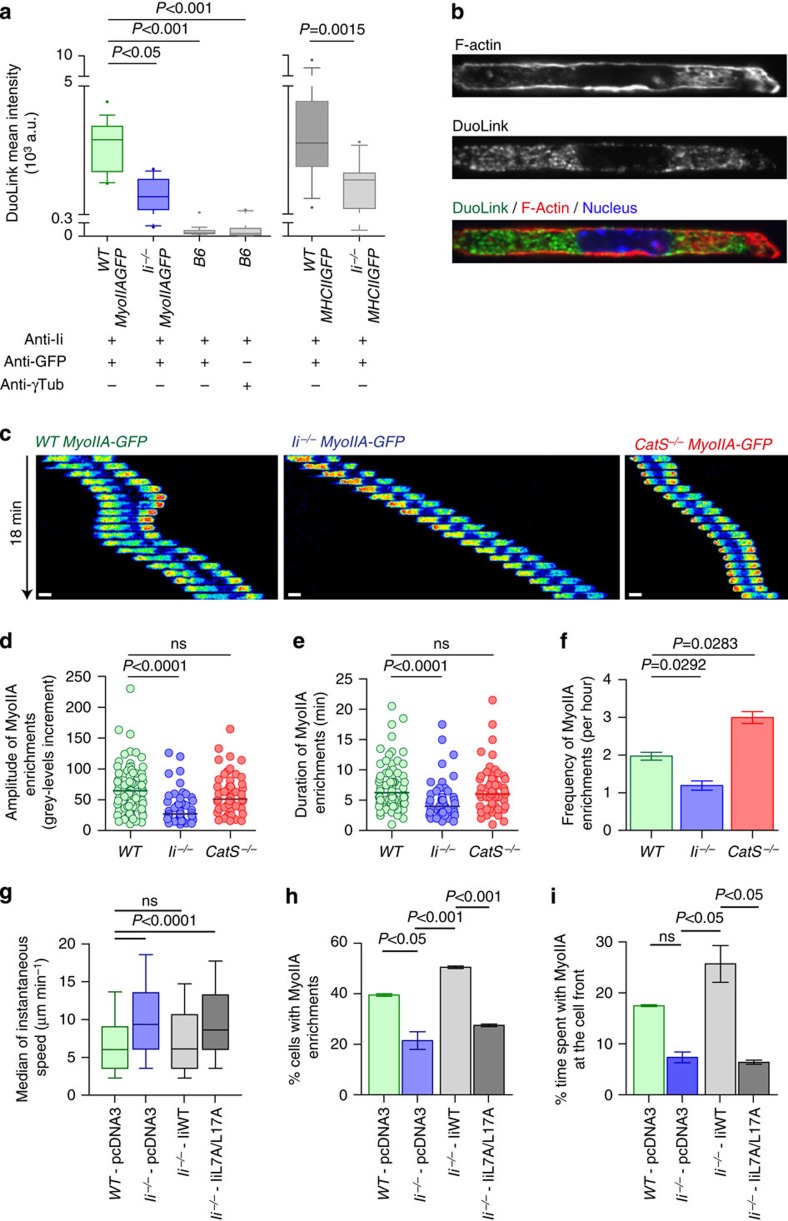
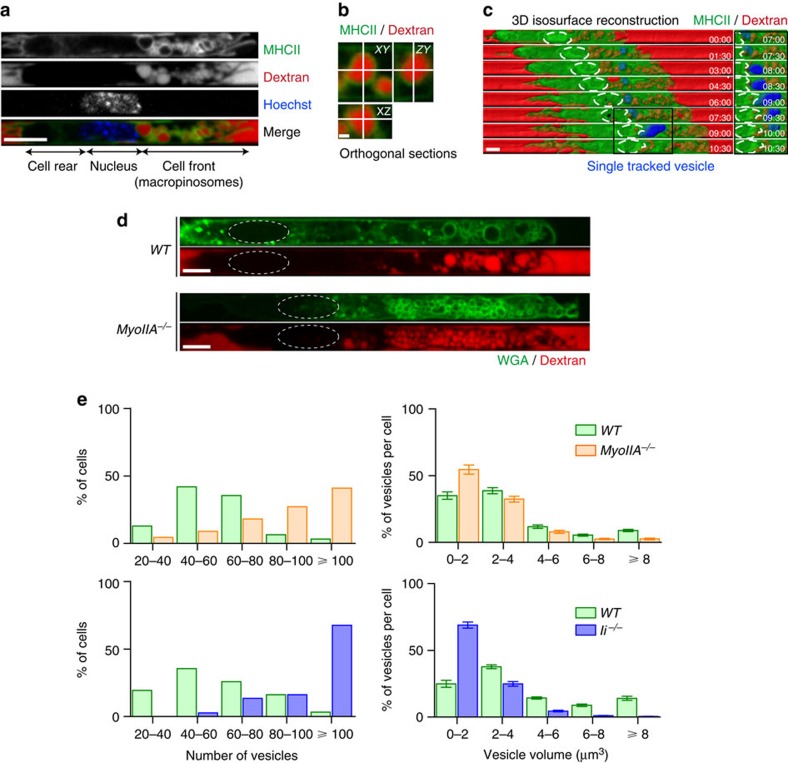
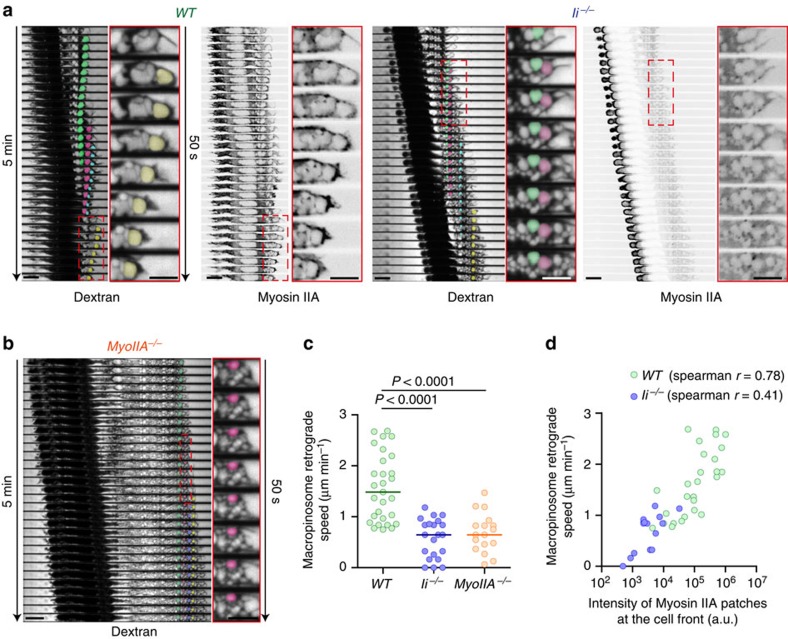
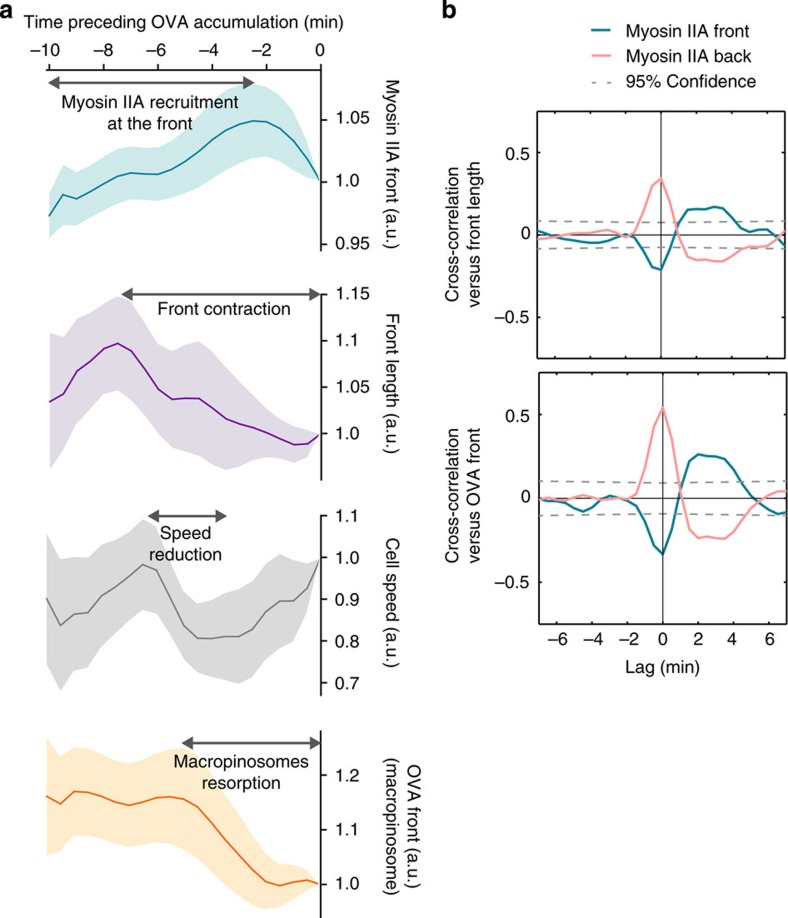
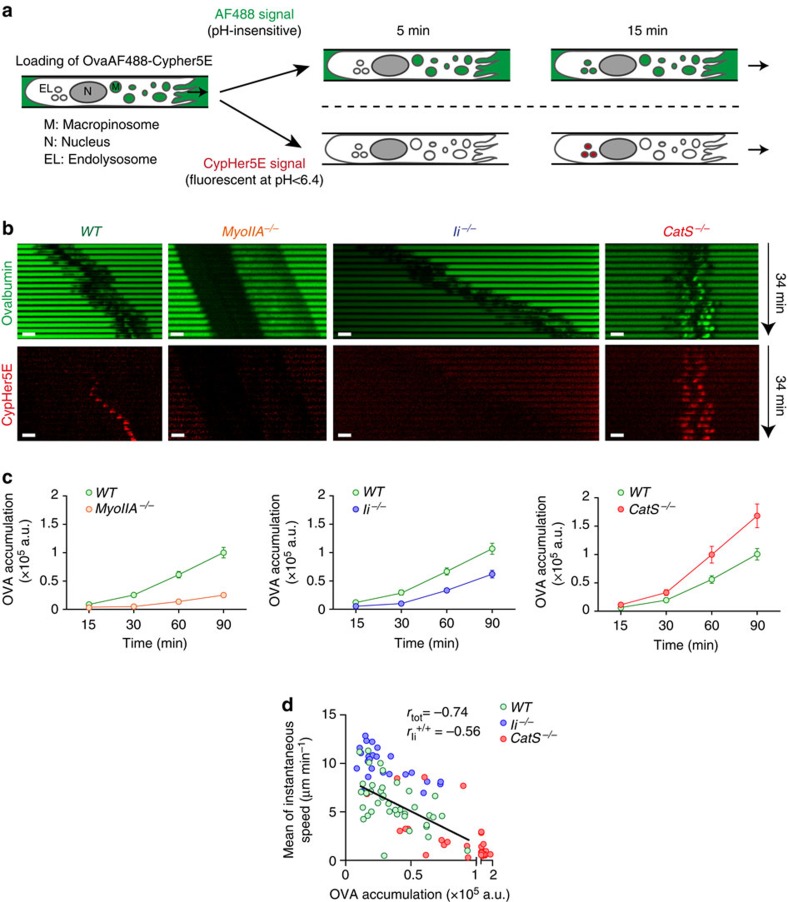
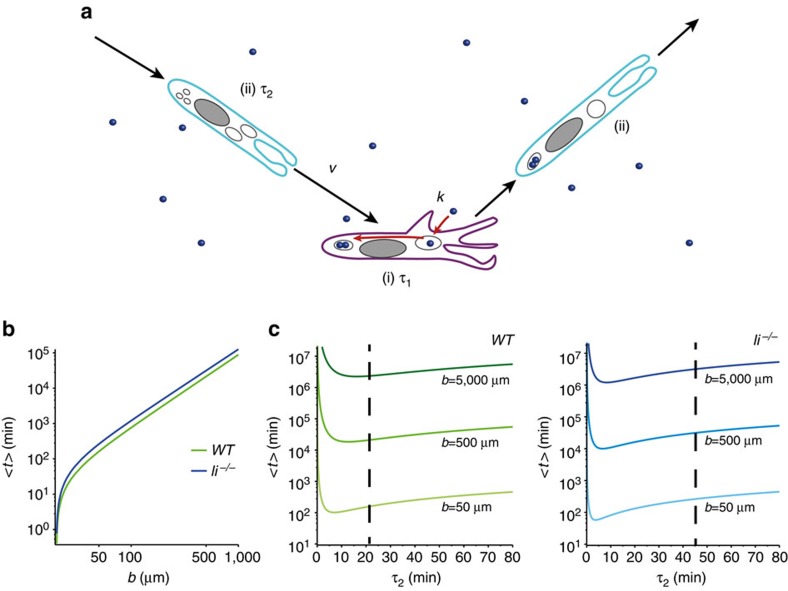
The immune response relies on the migration of leukocytes and on their ability to stop in precise anatomical locations to fulfil their task. How leukocyte migration and function are coordinated is unknown. Here we show that in immature dendritic cells, which patrol their environment by engulfing extracellular material, cell migration and antigen capture are antagonistic. This antagonism results from transient enrichment of myosin IIA at the cell front, which disrupts the back-to-front gradient of the motor protein, slowing down locomotion but promoting antigen capture. We further highlight that myosin IIA enrichment at the cell front requires the MHC class II-associated invariant chain (Ii). Thus, by controlling myosin IIA localization, Ii imposes on dendritic cells an intermittent antigen capture behaviour that might facilitate environment patrolling. We propose that the requirement for myosin II in both cell migration and specific cell functions may provide a general mechanism for their coordination in time and space.


Figures

Figure 1
Figure 1. Myosin IIA is enriched at the front of DCs during slow motility phases.
(a) Sequential epifluorescence images (× 20, one image every minute) of a myosin IIA-GFP knock-in DC exhibiting one event of myosin IIA-GFP enrichment at the cell front: the average intensity of myosin IIA-GFP at the front (1) and the back (2) relative to the average intensity of the entire cell were measured together with the cell instantaneous speed (obtained by tracking the nucleus centre of mass; 3). Scale bar, 10 μm. (b) Quantification of speed fluctuations (calculated as s.d./mean instantaneous speed in DCs displaying or not myosin IIA-GFP enrichments at the front within 15 min (n=50 cells and 44 cells, respectively, three independent experiments). Data are represented as box and whiskers (10–90 percentile) plus outliers. A Mann–Whitney test was applied for statistical analysis. (c) Layered curves of the three parameters described in (a) in a cell undergoing three phases of myosin IIA-GFP enrichment at the cell front. (d) Mean cross-correlation values obtained from the three parameters measured in (a) in 20 cells that underwent at least one event of myosin IIA-GFP enrichment at the front during motion (two independent experiments).
Figure 2
Figure 2. Myosin IIA enrichment at the front of DCs reduces their speed of locomotion.
(a) Schematic of the microfluidic device used to deliver drugs at the front or rear of DCs, composed of migration microchannels (5 × 5 μm) in between two fluidic chambers. Parallel flows were obtained by filling the ‘tanks tips' (with medium-containing drugs or not) but leaving the ‘waste tips' emptied, leading to the formation of a perpendicular gradient along migration channels. Clogging of a migration channel by one cell resulted in an on/off drug delivery. (b) Representative kymographs of cells receiving 200 μM Blebbistatin at t=15 min either at their front (left), rear (middle) or on both sides (right; × 10, one image every 30 s during 55 min). Scale bar, 20 μm. (c) Ratio of the mean instantaneous speed measured before and after delivery of Blebbistatin. Data from four independent experiments are represented as box and whiskers (10–90 percentile) and outliers (30–70 cells per condition). A Kruskal–Wallis test was applied for statistical analysis. (d) Smoothed instantaneous speed versus ratio of (total myosin IIA-GFP intensity at the cell front)/(total mosin IIA-GFP intensity at the cell rear) before and after delivery of 50 μM para-nitroblebbistatin (non-phototoxic blebbistatin, left panels) or DMSO (right panels) at the front of migrating myosin IIA-GFP knock-in immature DCs. Cells were classified in two groups: cells that have high amount of myosin IIA-GFP at their front (upper panels) or cells that have almost no myosin IIA-GFP at their front (lower panels) before treatment (n=18–20 cells per condition from four independent experiments). (e) Ratio of the mean instantaneous speed measured before and after delivery of Calyculin A. Data from four independent experiments are represented as box and whiskers (10–90 percentile) and outliers (30–70 cells per condition). A Kruskal–Wallis test was applied for statistical analysis.
Figure 3
Figure 3. Myosin IIA enrichment at the DC front is promoted by Ii.
(a) Quantification of the Duo-Link signal mean fluorescence intensity on the entire cell using different DC types and antibody combinations, as indicated. Data are represented as box and whiskers (10–90 percentile) plus outliers. n=12–17 cells per condition from one representative experiment out of three. A Kruskal–Wallis and a Mann–Whitney test was applied for statistical analysis of left and right panels, respectively. (b) Spinning disk images (× 100, middle plane) of a fixed immature WT myosin IIA-GFP knock-in DC after PCR-based Duo-Link amplification using anti-Ii and anti-GFP antibodies. Scale bar, 5 μm. (c) Sequential epifluorescence pseudocolour images (× 20, one image every min), of representative myosin IIA-GFP knock-in WT, Ii−/− and CatS−/− DCs. Scale bars, 10 μm. (d) Amplitude (grey level increment) and (e) duration of myosin IIA enrichments in myosin IIA-GFP knock-in WT, Ii−/− and CatS−/− DCs (n=80, 48 and 55 cells, respectively, four independent experiments). Bars represent the medians. Littermate controls were used. A Kruskal–Wallis test was applied for statistical analysis. (f) Number of myosin IIA enrichments per hour, in myosin IIA-GFP knock-in WT, Ii−/− and CatS−/− DCs (n=224, 174 and 122 cells, respectively, from eight independent experiments). A paired t-test was applied for statistical analysis. (g) The median of instantaneous speed of WT or Ii−/− bone marrow DCs transfected on day 6 of differentiation with an empty vector (WT-pcDNA3), full-length human Ii (Ii−/−-IiWT) or human Ii whose leucines 7 and 17 were replaced by alanines (Ii−/−-IiL7AL17A). Data from three independent experiments are represented as box and whiskers (10–90 percentile). n=430 cells per condition. A Kruskal–Wallis test was applied for statistical analysis. (h) Percentage of DCs exhibiting at least one event of myosin IIA-GFP enrichment at their front during 1 h of recording and (i) percentage of time spent with myosin IIA-GFP at the front of myosin IIA-GFP knock-in DCs transfected as described in g. Data from two independent experiments are shown (n=53 WT-pcDNA3, 36 Ii−/−-pcDNA3, 55 Ii−/−-IiWT and 67 Ii−/−-IiL7AL17A cells). One-way analysis of variance (ANOVA) Bonferroni tests were applied for statistical analysis.
Figure 4
Figure 4. Enrichment of myosin IIA at the front of DCs regulates macropinosome formation.
(a) Spinning disk image (× 60, middle plane) of a live MHCII-GFP knock-in immature DC migrating in a microchannel filled with 10 kDa AF647-Dextran. The nucleus was stained with Hoechst. (b) Orthogonal sections of a dextran-containing vesicle. Scale bar, 1 μm. (c) 3D isosurface reconstruction from a sequential 3D stack of 10 images with 0.5 μm z-step (× 60, one image every 30 s) of an MHCII-GFP immature DC migrating in a microchannel filled with 10 kDa AF647-Dextran. The nucleus position is indicated with dotted lines. A single vesicle is highlighted in blue for trafficking visualization, progressively switching from shade blue (when inside the cell, that is, below the green signal) to bright blue (once exposed outside). Zoomed images show an exocytotic event taking place in front of the nucleus. (d) Spinning disc images (× 60, middle plane) of live WT and myosin IIA−/− immature DCs (stained with 10 μg ml−1 AF488-WGA for membrane visualization) migrating in microchannels filled with 10 kDa AF647-Dextran. (e) Distribution of vesicle numbers (left panels) and volumes (right panels) in myosin IIA−/− and WT DCs (31 and 23 cells), Ii−/− and WT DCs (31 and 37 cells). Littermate controls were used. Cells were pooled from eight independent experiments and displayed altogether to overcome the limited amount of cells per experiment. Scale bars, 5 μm except when indicated.
Figure 5
Figure 5. Ii-dependent recruitment of myosin IIA to the front of DCs regulates macropinosome dynamics.
(a) Sequential spinning disc images (× 60, middle plan, one image every 10 s) of myosin IIA-GFP knock-in WT and Ii−/− immature DCs migrating in microchannels filled with 10 kDa AF647-Dextran. (b) Sequential spinning disc images (× 60, middle plan, one image every 10 s) of a myosin IIA−/− immature DC migrating in a microchannel filled with 10 kDa AF647-Dextran. (a,b) Single macropinosomes were colour-coded to follow their intracellular transport. (c) Macropinosome velocity in WT, Ii−/− and myosin IIA−/− DCs. Bars show the medians (n=29 WT, 21 Ii−/− and 17 myosin IIA−/− from two independent experiments). A Kruskal–Wallis test was applied for statistical analysis. (d) Correlative graph of macropinosome retrograde speed versus myosin IIA patches intensity at the cell front (n=28 WT and 22 Ii−/− from two independent experiments). WT DCs correspond to Ii+/+ DCs (littermate controls). Scale bars, 5 μm.
Figure 6
Figure 6. Myosin IIA enables antigen accumulation by promoting cell front contraction.
(a) Relative curves representing the mean intensity of myosin IIA-GFP signal at the DC front, the DC front length, the speed of DCs and the total intensity of fluorescent OVA signal at the DC front. Data were obtained during the 10 min preceding the arrival of OVA to endolysosomes, from 12 cells showing at least one event of myosin IIA-GFP at their front (three independent experiments). Data are represented as mean±s.e.m. (b) Mean cross-correlation values observed between the myosin IIA-GFP mean intensity at the cell front and back, the front length and the total intensity of the fluorescent OVA signal measured at the cell front. Data were obtained from 23 cells showing at least one event of myosin IIA-GFP at their front (four independent experiments).
Figure 7
Figure 7. Regulation of macropinosome dynamics by myosin IIA facilitates antigen transport to endolysosomes.
(a) Experimental design to monitor antigen transport to endolysosomes using OVA coupled to both AF488 (green) and CypHer5E (red). Arrows indicate the direction of migration. (b) Sequential wide field microscopy images (× 20, one image every 2 min) of WT, myosin IIA−/−, Ii−/− and CatS−/− immature DCs migrating along microchannels filled with AF488-OVA-CypHer5E. Scale bars, 10 μm. (c) OVA accumulation into endolysosomes in migrating myosin IIA−/− versus WT DCs (left), Ii−/− versus WT DCs (middle) and CatS−/− versus WT DCs (right) immature DCs, quantified as AF488-OVA sum intensity accumulated into CypHer5E-positive compartments normalized by the amount of OVA taken up at the cell front, represented as mean±s.e.m. Cells were pooled from two to three independent experiments (>50 cells per condition, WT DCs correspond to littermate controls). (d) Graph showing a correlation between the final levels (t=90 min) of AF488-OVA in endolysosomes and the mean of cell instantaneous velocities.
Figure 8
Figure 8. Ii optimizes the search of antigens by DCs.
(a) DC migration as an intermittent random walk: the intermittent random walk model assumes that DCs alternate between two migration phases (i) and (ii). In the slow phase (i; purple cell), of mean duration τ1, cell motion is neglected and antigen (blue particles) capture occurs at rate k (in all plots we consider the regime k>>1 of efficient antigen uptake). In the fast phase (ii; blue cell) of mean duration τ2, antigen capture is neglected and cell velocity is v. (b) Antigen mean search time <t> (log scale) expressed as a function of the mean distance b between antigen locations. Cell capture radius a=20 μm, all other parameters were determined from data shown in Fig. 3. WT: v=3.9 μm min−1, τ1=7.8 min, τ2=22.2 min. li−/−: v=8 μm min−1, τ1=5 min, τ2=45 min. (c) Mean search time for an antigen expressed as a function of τ2 for different antigen concentrations. Dashed lines highlight the values measured for τ2. Parameters as in (b).

References

    1. Sallusto F., Cella M., Danieli C. & Lanzavecchia A. Dendritic cells use macropinocytosis and the mannose receptor to concentrate macromolecules in the major histocompatibility complex class II compartment: downregulation by cytokines and bacterial products. J. Exp. Med. 182, 389–400 (1995). - PMC - PubMed
    1. Garrett W. S. et al.. Developmental control of endocytosis in dendritic cells by Cdc42. Cell 102, 325–334 (2000). - PubMed
    1. West M. A., Prescott A. R., Eskelinen E. L., Ridley A. J. & Watts C. Rac is required for constitutive macropinocytosis by dendritic cells but does not control its downregulation. Curr. Biol. 10, 839–848 (2000). - PubMed
    1. Norbury C. C. Drinking a lot is good for dendritic cells. Immunology 117, 443–451 (2006). - PMC - PubMed
    1. Farache J. et al.. Luminal bacteria recruit CD103(+) dendritic cells into the intestinal epithelium to sample bacterial antigens for presentation. Immunity 38, 581–595 (2013). - PMC - PubMed

Publication types

MeSH terms