

Cataloguing of Potential HIV Susceptibility Factors during the Menstrual Cycle of Pig-Tailed Macaques by Using a Systems Biology Approach
- PMID: 26109722
- PMCID: PMC4542353
- DOI: 10.1128/JVI.00263-15
Cataloguing of Potential HIV Susceptibility Factors during the Menstrual Cycle of Pig-Tailed Macaques by Using a Systems Biology Approach
Abstract
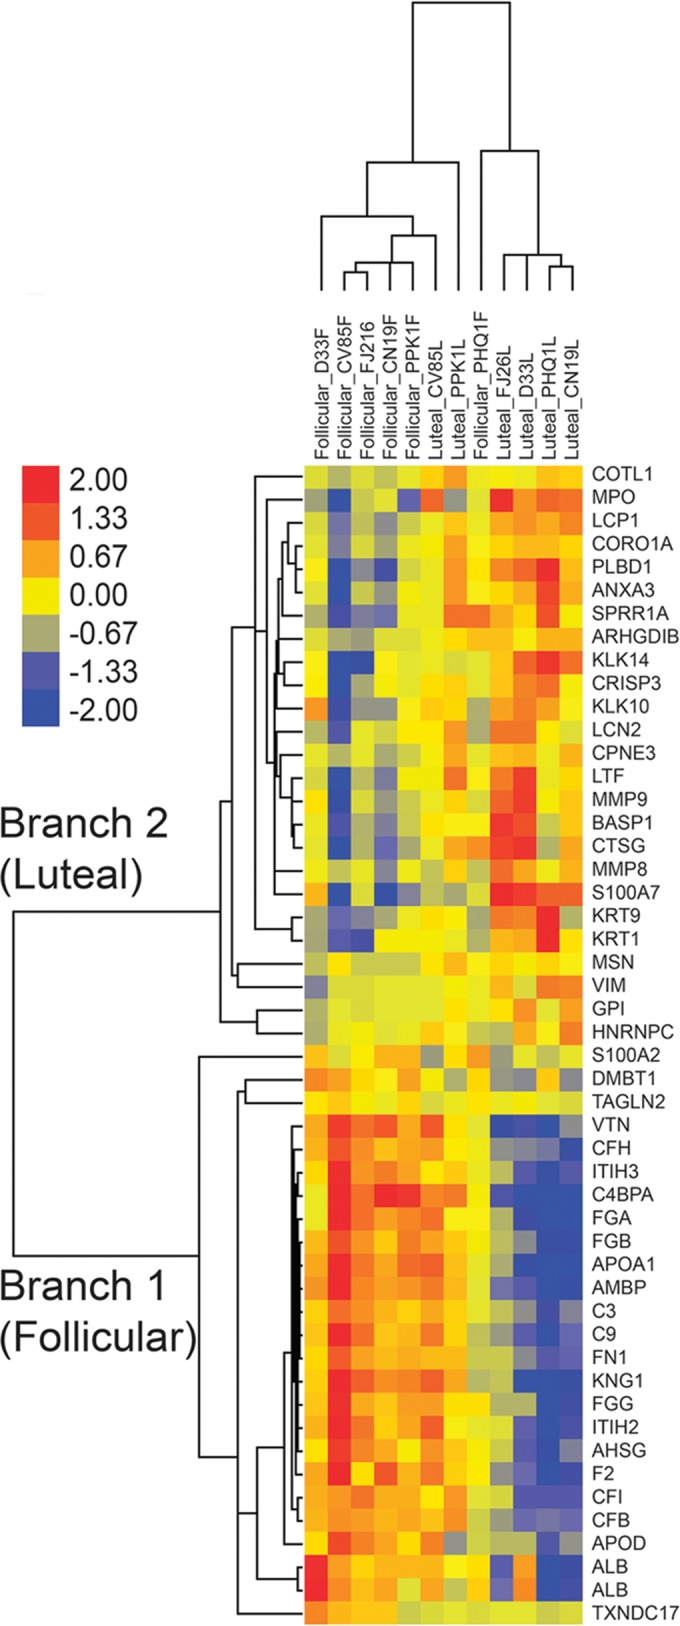
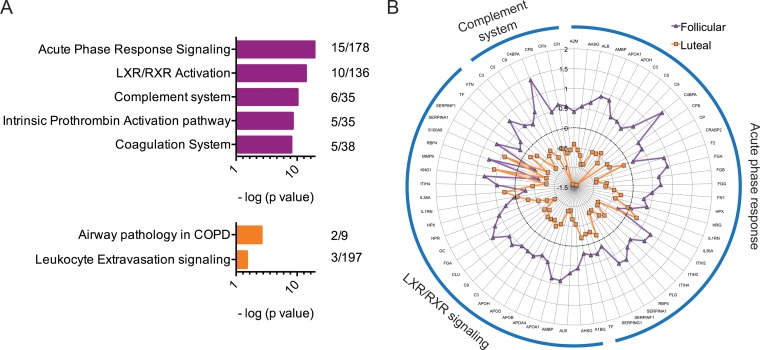
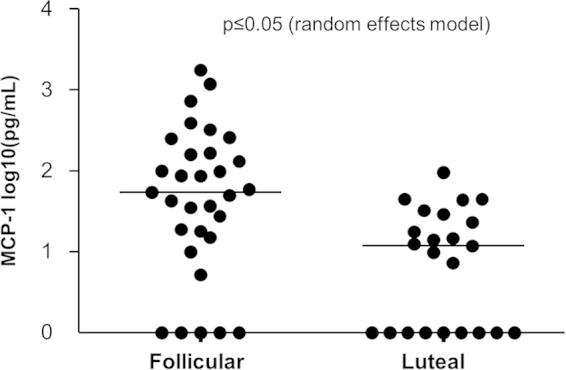
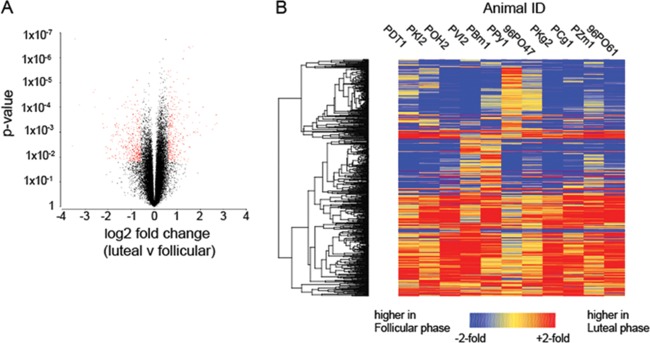
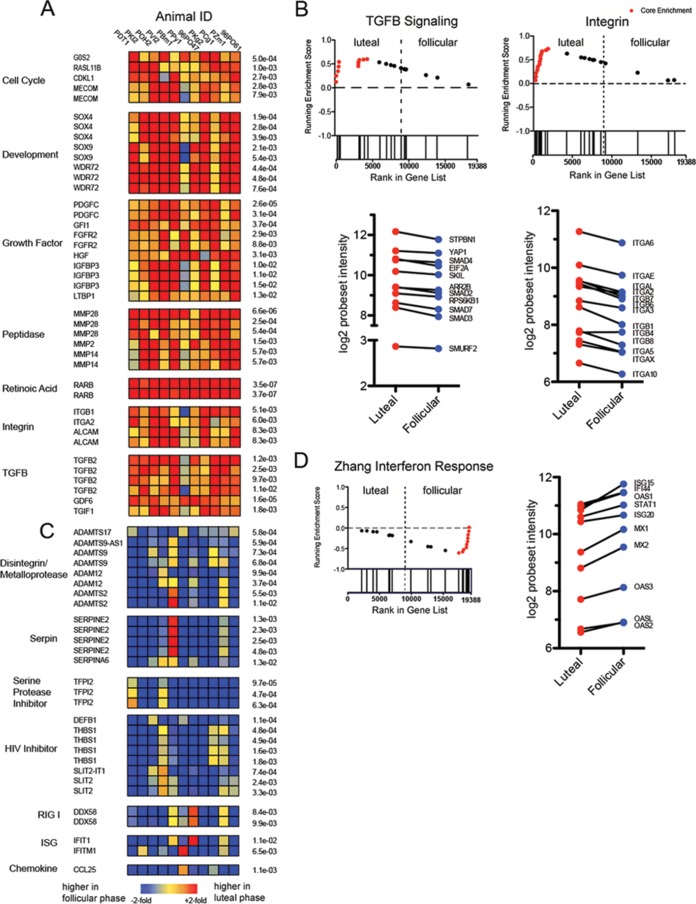
Our earlier studies with pig-tailed macaques demonstrated various simian-human immunodeficiency virus (SHIV) susceptibilities during the menstrual cycle, likely caused by cyclic variations in immune responses in the female genital tract. There is concern that high-dose, long-lasting, injectable progestin-based contraception could mimic the high-progesterone luteal phase and predispose women to human immunodeficiency type 1 (HIV-1) acquisition and transmission. In this study, we adopted a systems biology approach employing proteomics (tandem mass spectrometry), transcriptomics (RNA microarray hybridization), and other specific protein assays (enzyme-linked immunosorbent assays and multiplex chemokine and cytokine measurements) to characterize the effects of hormonal changes on the expression of innate factors and secreted proteins in the macaque vagina. Several antiviral factors and pathways (including acute-phase response signaling and complement system) were overexpressed in the follicular phase. Conversely, during the luteal phase there were factors overexpressed (including moesins, syndecans, and integrins, among others) that could play direct or indirect roles in enhancing HIV-1 infection. Thus, our study showed that specific pathways and proteins or genes might work in tandem to regulate innate immunity, thus fostering further investigation and future design of approaches to help counter HIV-1 acquisition in the female genital tract.
Importance: HIV infection in women is poorly understood. High levels of the hormone progesterone may make women more vulnerable to infection. This could be the case during the menstrual cycle, when using hormone-based birth control, or during pregnancy. The biological basis for increased HIV vulnerability is not known. We used an animal model with high risk for infection during periods of high progesterone. Genital secretions and tissues during the menstrual cycle were studied. Our goal was to identify biological factors upregulated at high progesterone levels, and we indeed show an upregulation of genes and proteins which enhance the ability of HIV to infect when progesterone is high. In contrast, during low-progesterone periods, we found more HIV inhibitory factors. This study contributes to our understanding of mechanisms that may regulate HIV infection in females under hormonal influences. Such knowledge is needed for the development of novel prevention strategies.
Copyright © 2015, American Society for Microbiology. All Rights Reserved.
Figures
Similar articles
-
Progestin-based contraception regimens modulate expression of putative HIV risk factors in the vaginal epithelium of pig-tailed Macaques.Am J Reprod Immunol. 2018 Oct;80(4):e13029. doi: 10.1111/aji.13029. Epub 2018 Aug 3. Am J Reprod Immunol. 2018. PMID: 30076667
-
SHIV susceptibility changes during the menstrual cycle of pigtail macaques.J Med Primatol. 2014 Oct;43(5):310-6. doi: 10.1111/jmp.12124. Epub 2014 Apr 29. J Med Primatol. 2014. PMID: 24779484 Free PMC article.
-
High susceptibility to repeated, low-dose, vaginal SHIV exposure late in the luteal phase of the menstrual cycle of pigtail macaques.J Acquir Immune Defic Syndr. 2011 Aug 1;57(4):261-4. doi: 10.1097/QAI.0b013e318220ebd3. J Acquir Immune Defic Syndr. 2011. PMID: 21546848
-
Comparison of the vaginal environment of Macaca mulatta and Macaca nemestrina throughout the menstrual cycle.Am J Reprod Immunol. 2014 Apr;71(4):322-9. doi: 10.1111/aji.12201. Epub 2014 Feb 13. Am J Reprod Immunol. 2014. PMID: 24521395 Free PMC article. Review.
-
The relationship between sex hormones, the vaginal microbiome and immunity in HIV-1 susceptibility in women.Dis Model Mech. 2018 Aug 28;11(9):dmm035147. doi: 10.1242/dmm.035147. Dis Model Mech. 2018. PMID: 30154116 Free PMC article. Review.
Cited by
-
Increases in Endogenous or Exogenous Progestins Promote Virus-Target Cell Interactions within the Non-human Primate Female Reproductive Tract.PLoS Pathog. 2016 Sep 22;12(9):e1005885. doi: 10.1371/journal.ppat.1005885. eCollection 2016 Sep. PLoS Pathog. 2016. PMID: 27658293 Free PMC article.
-
Nonhuman primate models for the evaluation of HIV-1 preventive vaccine strategies: model parameter considerations and consequences.Curr Opin HIV AIDS. 2016 Nov;11(6):546-554. doi: 10.1097/COH.0000000000000311. Curr Opin HIV AIDS. 2016. PMID: 27559710 Free PMC article. Review.
-
Molecular Signatures of Immune Activation and Epithelial Barrier Remodeling Are Enhanced during the Luteal Phase of the Menstrual Cycle: Implications for HIV Susceptibility.J Virol. 2015 Sep;89(17):8793-805. doi: 10.1128/JVI.00756-15. Epub 2015 Jun 17. J Virol. 2015. PMID: 26085144 Free PMC article.
-
Hepatitis B, HIV, and Syphilis Seroprevalence in Pregnant Women and Blood Donors in Cameroon.Infect Dis Obstet Gynecol. 2016;2016:4359401. doi: 10.1155/2016/4359401. Epub 2016 Aug 8. Infect Dis Obstet Gynecol. 2016. PMID: 27578957 Free PMC article.
-
Characterization of the Genital Mucosa Immune Profile to Distinguish Phases of the Menstrual Cycle: Implications for HIV Susceptibility.J Infect Dis. 2019 Feb 23;219(6):856-866. doi: 10.1093/infdis/jiy585. J Infect Dis. 2019. PMID: 30383238 Free PMC article.
References
-
- Hickey DK, Patel MV, Fahey JV, Wira CR. 2011. Innate and adaptive immunity at mucosal surfaces of the female reproductive tract: stratification and integration of immune protection against the transmission of sexually transmitted infections. J Reprod Immunol 88:185–194. doi:10.1016/j.jri.2011.01.005. - DOI - PMC - PubMed
Publication types
MeSH terms
Substances
Grants and funding
LinkOut - more resources
Full Text Sources
Medical
Molecular Biology Databases
