. 2015 Sep;89(17):9080-9.
doi: 10.1128/JVI.00983-15. Epub 2015 Jun 24.

Superoxide-Generating Nox5α Is Functionally Required for the Human T-Cell Leukemia Virus Type 1-Induced Cell Transformation Phenotype

Affiliations

Superoxide-Generating Nox5α Is Functionally Required for the Human T-Cell Leukemia Virus Type 1-Induced Cell Transformation Phenotype

Tomonari Shigemura et al. J Virol. 2015 Sep.

Abstract

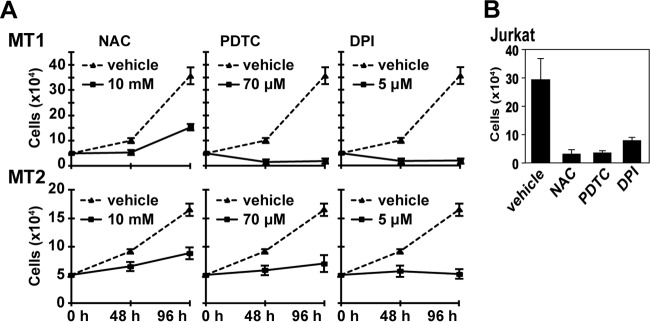
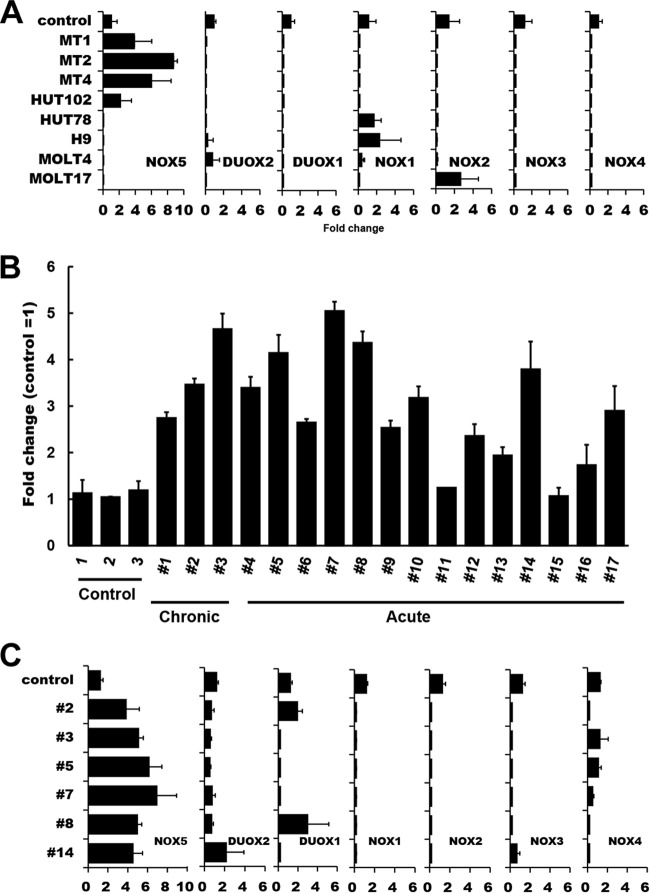
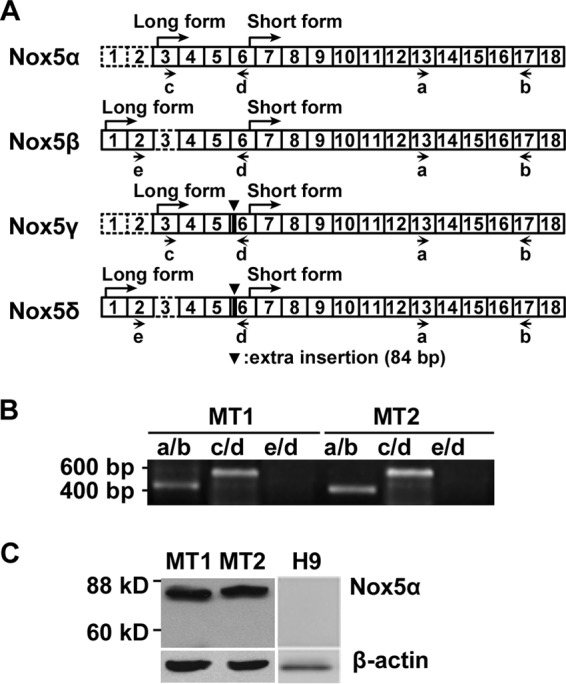
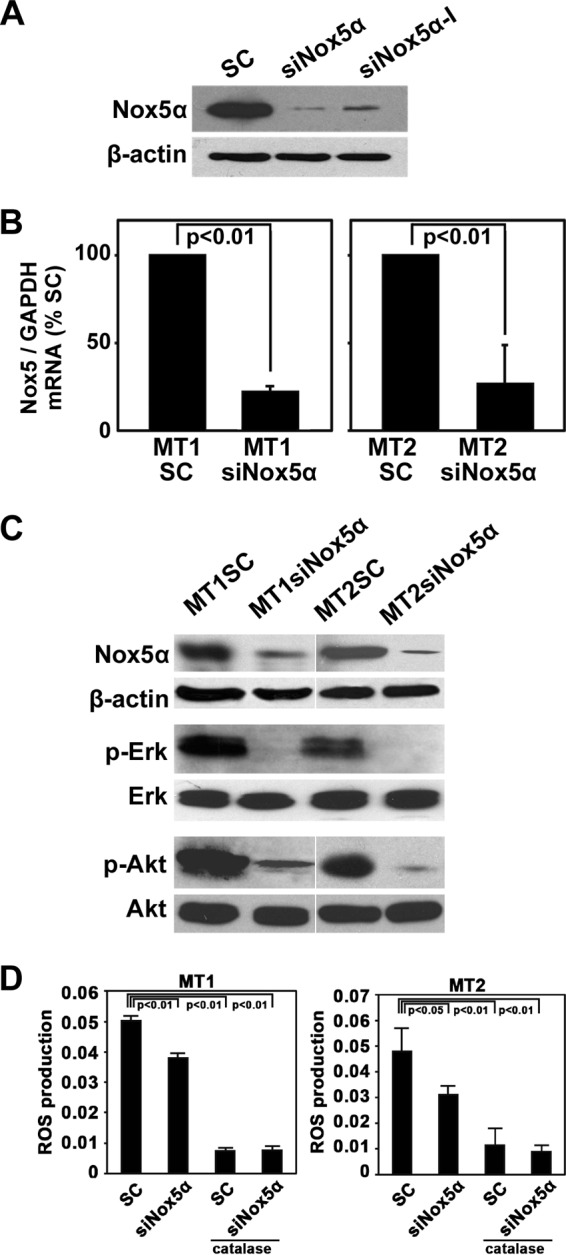
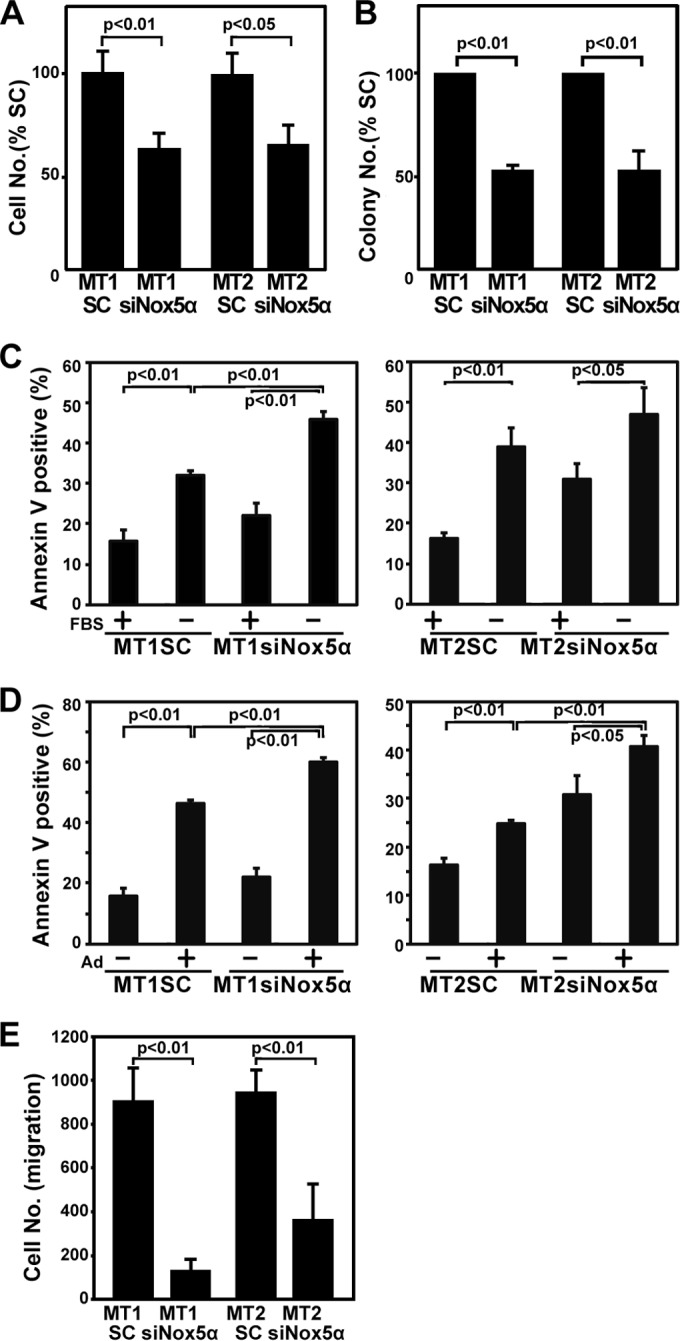
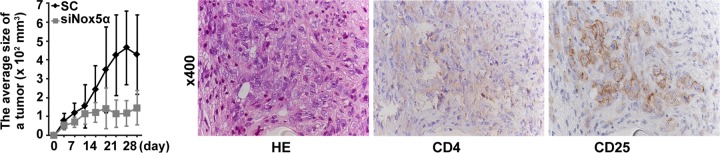
Human T-cell leukemia virus type 1 (HTLV-1) is associated with adult T-cell leukemia (ATL) and transforms T cells in vitro. To our knowledge, the functional role of reactive oxygen species (ROS)-generating NADPH oxidase 5 (Nox5) in HTLV-1 transformation remains undefined. Here, we found that Nox5α expression was upregulated in 88% of 17 ATL patient samples but not in normal peripheral blood T cells. Upregulation of the Nox5α variant was transcriptionally sustained by the constitutive Janus family tyrosine kinase (Jak)-STAT5 signaling pathway in interleukin-2 (IL-2)-independent HTLV-1-transformed cell lines, including MT1 and MT2, whereas it was transiently induced by the IL-2-triggered Jak-STAT5 axis in uninfected T cells. A Nox inhibitor, diphenylene iodonium, and antioxidants such as N-acetyl cysteine blocked proliferation of MT1 and MT2 cells. Ablation of Nox5α by small interfering RNAs abrogated ROS production, inhibited cellular activities, including proliferation, migration, and survival, and suppressed tumorigenicity in immunodeficient NOG mice. The findings suggest that Nox5α is a key molecule for redox-signal-mediated maintenance of the HTLV-1 transformation phenotype and could be a potential molecular target for therapeutic intervention in cancer development.

Importance: HTLV-1 is the first human oncogenic retrovirus shown to be associated with ATL. Despite the extensive study over the years, the mechanism underlying HTLV-1-induced cell transformation is not fully understood. In this study, we addressed the expression and function of ROS-generating Nox family genes in HTLV-1-transformed cells. Our report provides the first evidence that the upregulated expression of Nox5α is associated with the pathological state of ATL peripheral blood mononuclear cells and that Nox5α is an integral component of the Jak-STAT5 signaling pathway in HTLV-1-transformed T cells. Nox5α-derived ROS are critically involved in the regulation of cellular activities, including proliferation, migration, survival, and tumorigenicity, in HTLV-1-transformed cells. These results indicate that Nox5α-derived ROS are functionally required for maintenance of the HTLV-1 transformation phenotype. The finding provides new insight into the redox-dependent mechanism of HTLV-1 transformation and raises an intriguing possibility that Nox5α serves as a potential molecular target to treat HTLV-1-related leukemia.


Figures

FIG 1
FIG 1
Effects of antioxidants and DPI on proliferation of HTLV-1-infected MT1 and MT2 cells. (A) MT1 and MT2 cells (5 × 10⁴) were cultured in the presence or absence of the indicated amounts of NAC, PDTC, and DPI. The cell growth was determined at the indicated time intervals. The data represent means ± standard deviations (SD) (n = 3) of the results from four separate experiments. (B) Jurkat T cells (5 × 10⁴) were cultured in the presence of DPI (0.5 μM), PDTC (14 μM), NAC (2 mM), or dimethyl sulfoxide (DMSO) for 48 h, and the cells were counted. The data represent means ± SD (n = 3) of the results from three separate experiments. For the data presented throughout panels A and B, statistical analysis was performed with one-way ANOVA, followed by Dunnett's multiple-comparison t test. P value for comparisons of chemical treatment versus vehicle, <0.05.
FIG 2
FIG 2
Analysis of Nox family expression in HTLV-1-infected T-cell lines and ATL PBMC. (A) Total RNAs were extracted from various HTLV-1-infected (MT1, MT2, MT4, and HUT102) and HTLV-1-uninfected (HUT78, H9, MOLT4, and MOLT17) T cells, and levels of mRNA expression of Nox family members were analyzed by real-time PCR. Control data represent normal T cells. One-way ANOVA was performed to determine differences between HTLV-1-infected and -uninfected cell lines. There was a statistically significant difference only in the Nox5 expression data (P < 0.05 versus control). (B) The levels of Nox5 mRNA expression in ATL primary cells (Table 1) were examined by real-time PCR. CTL (control), normal PBMC. The data represent means ± SD (n = 3) of results from three separate experiments. (C) Comparison of levels of Nox isoform expression in ATL patient samples. A total of 6 samples were randomly selected from 17 ATL patient samples which had been analyzed as described for panel B and subjected to the analysis of Nox isoform expression by real-time PCR. Control, normal PBMC. β-Actin was used as an internal control. The data represent means ± SD (n = 3) of results from three separate experiments. Note that, among the Nox family members, only the levels of Nox5 were increased in the 6 ATL patient samples examined.
FIG 3
FIG 3
Identification of Nox5α variants in MT1 and MT2 cells. (A) A schematic figure shows the configuration of exons in four Nox5 splice variants (α, β, γ, and δ) belonging to an l-form and in Nox5S, a short form lacking an N-terminal calmodulin-like Ca2+ binding domain. The exons were numbered based on GenBank sequences as follows: α, AF353088; β, AF325189; γ, AF353089; δ, AF325190. Letters a to e indicate the positions of primers used for PCR analysis as described for panel B. (B) Levels of mRNA expression of Nox5 variants in MT1 and MT2 cells were analyzed by RT-PCR. Primers a, b, c, d, and e were assigned as shown in Fig. 3A. PCR products were analyzed by sequencing. (C) Lysates from MT1, MT2, and H9 cells were prepared and subjected to immunoblotting with antibodies against the COOH-end peptide of Nox5. β-Actin was used as a loading control.
FIG 4
FIG 4
Nox5α siRNA reduces both phosphorylation of Erk and AKT and ROS production. (A) Lysates were prepared from MT2 cells transfected with scrambled siRNA (SC) or a Nox5-specific siRNA (siNox5α or siNox5α-I) and were subjected to immunoblotting with anti-Nox5 or anti-β-actin antibodies. (B) MT1 and MT2 cell lines stably transfected with Nox5α siRNA (MT1siNox5α and MT2siNox5α) or scrambled siRNA (MT1SC and MT2SC) were established. Expression levels of Nox5α mRNAs were examined by real-time PCR using GAPDH (glyceraldehyde-3-phosphate dehydrogenase) as an internal control. The data represent means ± SD (n = 3) of results from three separate experiments. Student's t test was performed. (C) Expression levels of endogenous Nox5α proteins in the indicated cell lines were determined by immunoblotting with anti-Nox5 antibodies.β-Actin was used as a loading control. Alternatively, phosphorylation levels of Erk and AKT were examined by immunoblotting with anti-phospho-Erk and anti-phospho-AKT antibodies. (D) Levels of intracellular ROS in MT1siNox5α, MT1SC, MT2siNox5α, and MT2SC cells were measured by luminol assay in the presence or absence of catalase (250 U/ml). The data represent means ± SD (n = 4) of results from three separate experiments. Statistical analysis was performed with ANOVA, followed by the Bonferroni test.
FIG 5
FIG 5
Inhibition of Nox5 suppresses proliferation, cell survival, and migration of MT1 and MT2 cells. (A) Growth rates of indicated cell lines in liquid culture. Cells (5 × 10³) were plated, and the numbers of live cells were determined 48 h later. The cell numbers of MT1SC and MT2SC at 48 h were 1.5 × 10⁴ and 1.0 × 10⁴, respectively. The data represent means ± SD (n = 3) of results from three separate experiments. Student's t test was performed. (B) Cells (5 × 10³) were inoculated into 6-well plates in 1 ml of MethoCult (H4230; Stemcell Technologies, Tukwila, WA) containing 10% FBS. Colonies were counted 10 days later. The data represent means ±SD (n = 3) of results from three separate experiments. Student's t test was performed. (C and D) MT1SC, MT1siNox5α, MT2SC, and MT2siNox5α cells were serum (FBS) starved for 48 h (C) or treated with 4 μM adriamycin (Ad) for 48 h (D) using the indicated combinations and subjected to an annexin V-apoptosis assay. The data represent means ± SD (n = 3) of results from four separate experiments. One-way ANOVA was performed, followed by the Bonferroni test. (E) Cells were plated and subjected to a cell migration assay as described in Materials and Methods. The data represent means ± SD (n = 4) of results from three separate experiments. Student's t test was performed.
FIG 6
FIG 6
Nox5α expression is blocked by inhibition of Jak, BCR-Ab1, and STAT5. (A) MT1, MT2, and K562 cells were treated with 50 μM AG490 (Jak inhibitor) or 250 nM STI-571 (BCR-Ab1 inhibitor) for 24 h, and levels of Nox5α expression were examined by RT-PCR. (B) Jurkat T cells were treated with IL-2 (100 ng/ml) in the presence or absence of 50 μM AG490 for 24 h, and Nox5α expression was examined by RT-PCR. (C) MT1, MT2, and K562 cells were transfected with STAT5B siRNA or scrambled siRNA, and the levels of expression of Nox5α, STAT5A, and STAT5B were examined by RT-PCR. (D) Jurkat T cells were transfected with STAT5B siRNAs or with scrambled siRNA and stimulated with IL-2 (100 ng/ml) for 24 h or left unstimulated. The levels of expression of Nox5α, STAT5A, and STAT5B were examined by RT-PCR. In the experiments whose results are shown throughout panels A to D, β-actin was used as an internal control. (E and F) MT1, MT2, and K562 cells were treated with 50 μM AG490 for 24 h (E); alternatively, HEK293 cells were transfected with Bcr-Abl or control vector and treated with 250 nM STI-571 for 24 h (F). Lysates were subjected to immunoblotting with anti-phospho-STAT5 (Tyr694) and anti-STAT5 antibodies. (G) Nox5α is not upregulated in HTLV-II-infected T cells. The levels of Nox5α expression in Mot (HTLV-II-infected T cell line), MT1, and MT2 cells were examined by RT-PCR. (H) Nox5α expression is induced in IL-2- or PHA/PMA-stimulated PBMC. PBMC were treated with IL-2 (100 ng/ml) or PHA (100 ng/ml)/PMA (5 μg/ml) for 24 h and subjected to RT-PCR analysis of Nox5α expression. β-Actin was used as an internal control in the experiments whose results are shown in panels G and H.
FIG 7
FIG 7
Activation of Nox5α promoter activity through STAT5. (A) Schematic structure of the 5′-flanking region of the Nox5α promoter. The consensus STAT5-binding sites (TTCCCTTAA) are shown in the Nox5α promoter region (−1502 to −11 from ATG in exon 3) subcloned into pGL3basic. (B) MT1 and MT2 cells were transfected with pGL3-Nox5α (−1502 to −11) together with STAT5B siRNAs or control siRNAs. Lysates were subjected to a reporter assay. The data represent means ± SD (n = 3) of results from three separate experiments. Student's t test was performed. (C) Jurkat T cells were transfected with pGL3-Nox5α (−1502 to −11) together with pGD210-Bcr-Ab1 or control vectors and treated with STAT5 inhibitor (250 nM) for 24 h. Lysates were subjected to a reporter assay. The data represent means ± SD (n = 3) of results from three separate experiments. One-way ANOVA was performed, followed by the Bonferroni test. (D) Jurkat T cells were cotransfected with pGL3-Nox5α (−1502 to −11) together with the STAT5B-CA mutant or control vector and subjected to a reporter assay. The data represent means ± SD (n = 3) of results from three separate experiments. Statistical analysis was performed with Student's t test.
FIG 8
FIG 8
Tumor formation by Nox5α siRNA-transfected and control siRNA-transfected cell lines. MT2sc and MT2siNox5α cells were inoculated into NOG mice, and the growth rate of tumor was monitored by measuring tumor volumes over a 4-week period. The data represent means ± SD (n = 6). Student's t test was performed. P > 0.05 (versus scrambled data at 4 to 14 days; P < 0.05 (versus scrambled data at 17 to 28 days). Tumor samples were immunostained with anti-CD4 and anti-CD25 antibodies and counterstained with hematoxylin-eosin (HE).

Similar articles

Cited by

References

    1. Hinuma Y, Nagata K, Hanaoka M, Nakai M, Matsumoto T, Kinoshita KI, Shirakawa S, Miyoshi I. 1981. Adult T-cell leukemia: antigen in an ATL cell line and detection of antibodies to the antigen in human sera. Proc Natl Acad Sci U S A 78:6476–6480. doi:10.1073/pnas.78.10.6476. - DOI - PMC - PubMed
    1. Poiesz BJ, Ruscetti FW, Gazdar AF, Bunn PA, Minna JD, Gallo RC. 1980. Detection and isolation of type C retrovirus particles from fresh and cultured lymphocytes of a patient with cutaneous T-cell lymphoma. Proc Natl Acad Sci U S A 77:7415–7419. doi:10.1073/pnas.77.12.7415. - DOI - PMC - PubMed
    1. Miyoshi I, Kubonishi I, Yoshimoto S, Akagi T, Ohtsuki Y, Shiraishi Y, Nagata K, Hinuma Y. 1981. Type C virus particles in a cord T-cell line derived by co-cultivating normal human cord leukocytes and human leukaemic T cells. Nature 294:770–771. doi:10.1038/294770a0. - DOI - PubMed
    1. Popovic M, Lange-Wantzin G, Sarin PS, Mann D, Gallo RC. 1983. Transformation of human umbilical cord blood T cells by human T-cell leukemia/lymphoma virus. Proc Natl Acad Sci U S A 80:5402–5406. doi:10.1073/pnas.80.17.5402. - DOI - PMC - PubMed
    1. Grassmann R, Berchtold S, Radant I, Alt M, Fleckenstein B, Sodroski JG, Haseltine WA, Ramstedt U. 1992. Role of human T-cell leukemia virus type 1 X region proteins in immortalization of primary human lymphocytes in culture. J Virol 66:4570–4575. - PMC - PubMed

Publication types

MeSH terms

LinkOut - more resources