Review
. 2015 Jun 5;25(2):141-51.
doi: 10.11613/BM.2015.015. eCollection 2015.

Understanding Bland Altman analysis

Affiliations
Review

Understanding Bland Altman analysis

Davide Giavarina. Biochem Med (Zagreb). .

Abstract

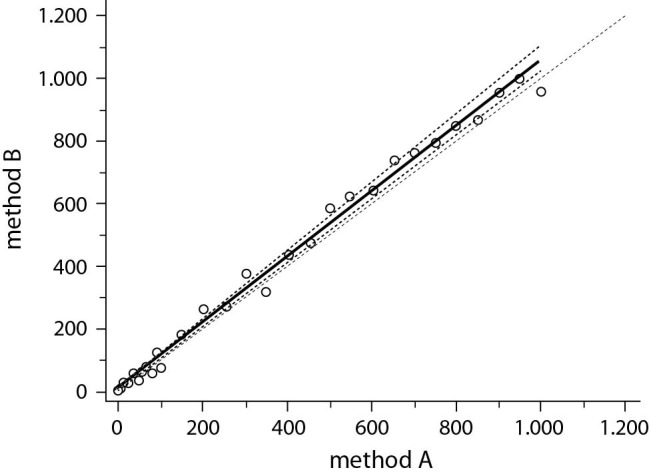
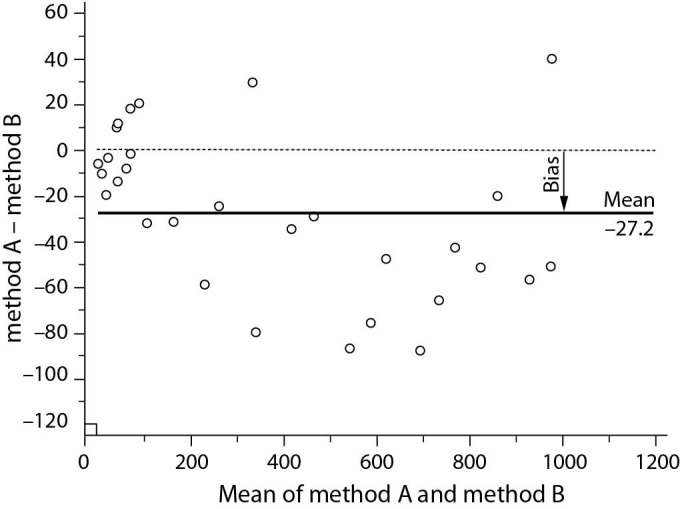
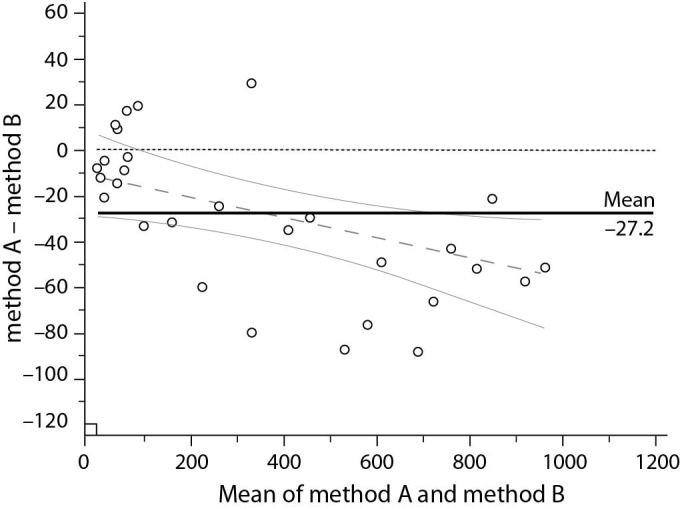
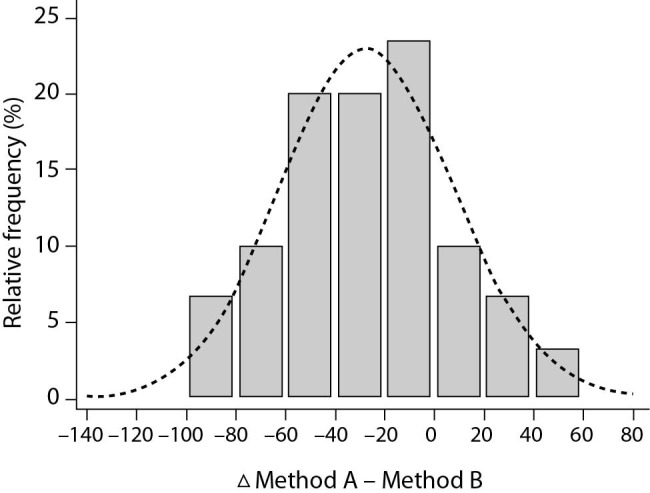
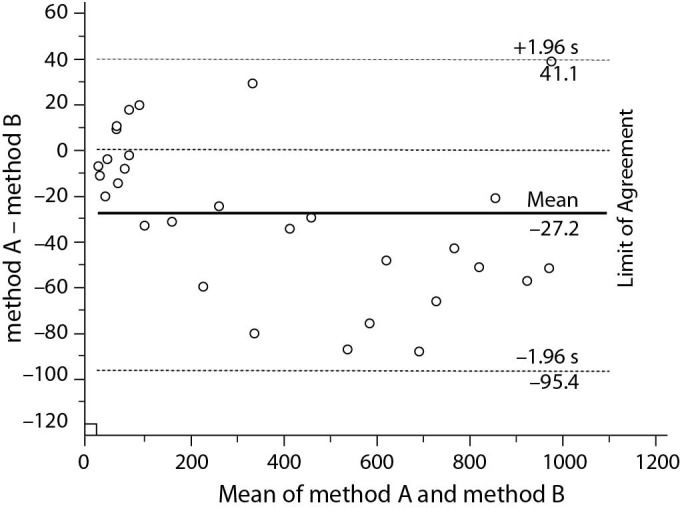
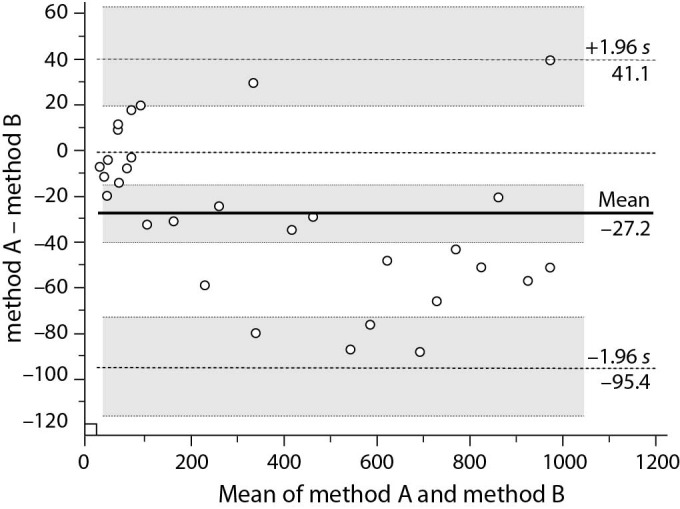
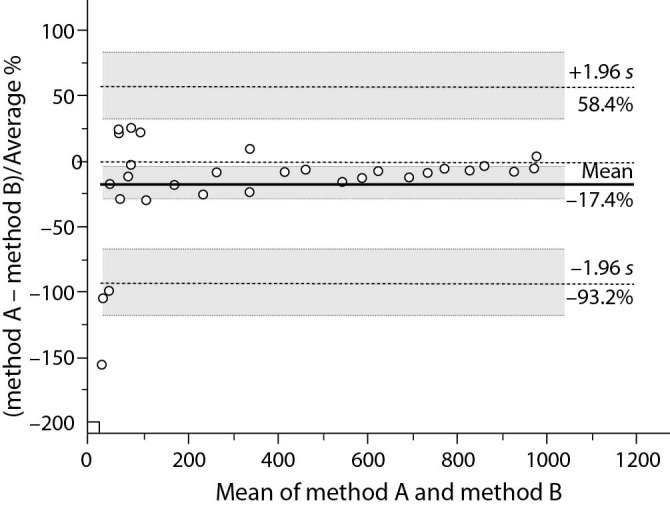
In a contemporary clinical laboratory it is very common to have to assess the agreement between two quantitative methods of measurement. The correct statistical approach to assess this degree of agreement is not obvious. Correlation and regression studies are frequently proposed. However, correlation studies the relationship between one variable and another, not the differences, and it is not recommended as a method for assessing the comparability between methods. In 1983 Altman and Bland (B&A) proposed an alternative analysis, based on the quantification of the agreement between two quantitative measurements by studying the mean difference and constructing limits of agreement. The B&A plot analysis is a simple way to evaluate a bias between the mean differences, and to estimate an agreement interval, within which 95% of the differences of the second method, compared to the first one, fall. Data can be analyzed both as unit differences plot and as percentage differences plot. The B&A plot method only defines the intervals of agreements, it does not say whether those limits are acceptable or not. Acceptable limits must be defined a priori, based on clinical necessity, biological considerations or other goals. The aim of this article is to provide guidance on the use and interpretation of Bland Altman analysis in method comparison studies.

Keywords: Bland-Altman; agreement analysis; correlation of data; laboratory research; method comparison.


Conflict of interest statement

None declared.

Figures

Figure 1
Figure 1
The regression line between hypothetical measurements done by method A and method B.
Regression equation is expressed as: y = a (95% CI) + b (95% CI) x (Passing & Bablok regression) (21). Regression line has a slope of 1.06 (1.02 to 1.09) and an intercept of 7.08 (-0.30 to 19.84). Correlation coefficient between the two methods is r = 0.996 95% confidence interval, CI = 0.991-0.998, P < 0.001.
Figure 2
Figure 2
Plot of differences between method A and method B vs. the mean of the two measurements (data from table 1). The bias of -27.2 units is represented by the gap between the X axis, corresponding to a zero differences, and the parallel line to the X axis at -27.2 units.
Figure 3
Figure 3
The same plot as Figure 1 including regression line and confidence interval limits.
Dotted line represents the regression line (y = -0.05 (-0.08 to -0.01)x – 10.15 (-28.07 to 7.77) confidence interval limits are presented as continuous line.
Figure 4
Figure 4
Distribution plot of differences between measurement by methods A and B.
The dotted line represents Normal distribution. Shapiro-Wilk test for normal distribution accepted normality (P = 0.814).
Figure 5
Figure 5
Bland and Altman plot for data from the table 1, with the representation of the limits of agreement (doted line), from -1.96s to +1.96s.
Figure 6
Figure 6
Same plot as Figure 2, with the representation of confidence interval limits for mean and agreement limits (shaded areas, data from table 2).
Figure 7
Figure 7
Plot of differences between method A and method B, expressed as percentages of the values on the axis [(method A – Method B)/mean%)], vs. the mean of the two measurements (data from table 1). Shaded areas present confidence interval limits for mean and agreement limits.
Figure 8
Figure 8
Method comparisons of two measurements in five different cases presented as regression analysis (column 1), Bland and Altman plot where differences are presented as units (column 2) and Bland and Altman plot where differences are presented as percentage (column 3). Cases A, B, C, D and E represent hypothetical examples: A - random variability; B - constant variability, s = ± 50 units; C - constant coefficient of variation, CV% = 5%; D - constant error of plus 15 units in method B, given the same proportional variability (CV%) of 5%, as in case C; E - proportional constant error over CV% = 5%. Regression equation is expressed as: y= a (95% CI) + b (95% CI)x.
CI – confidence interval.

References

    1. Eksborg S. Evaluation of method-comparison data. Clin Chem. 1981;27:1311–2. - PubMed
    1. Altman DG, Bland JM. Measurement in medicine: the analysis of method comparison studies. Statistician. 1983;32:307–17. 10.2307/2987937 - DOI
    1. Udovičić M, Baždarić K, Bilić-Zulle L, Petrovečki M. What we need to know when calculating the coefficient of correlation? Biochem Med (Zagreb). 2007;17:10–5. 10.11613/BM.2007.002 - DOI
    1. Martin RF. General Deming regression for estimating systematic bias and its confidence interval in method-comparison studies. Clin Chem. 2000;46:100–4. - PubMed
    1. Bilić-Zulle L. Comparison of methods: Passing and Bablok regression. Biochem Med (Zagreb). 2011;21:49–52. 10.11613/BM.2011.010 - DOI - PubMed

MeSH terms