. 2015 Jun 23:2:150022.
doi: 10.1038/sdata.2015.22. eCollection 2015.

Proteomic analysis of colon and rectal carcinoma using standard and customized databases

Affiliations

Proteomic analysis of colon and rectal carcinoma using standard and customized databases

Robbert J C Slebos et al. Sci Data. .

Erratum in

Abstract

Understanding proteomic differences underlying the different phenotypic classes of colon and rectal carcinoma is important and may eventually lead to a better assessment of clinical behavior of these cancers. We here present a comprehensive description of the proteomic data obtained from 90 colon and rectal carcinomas previously subjected to genomic analysis by The Cancer Genome Atlas (TCGA). Here, the primary instrument files and derived secondary data files are compiled and presented in forms that will allow further analyses of the biology of colon and rectal carcinoma. We also discuss new challenges in processing these large proteomic datasets for relevant proteins and protein variants.


Conflict of interest statement

The authors declare no competing financial interests.

Figures

Figure 1
Figure 1. Comparison of identified spectra, peptides and proteins by the three search engines Myrimatch, Pepitome and MS-GF+.
Over 93% of the proteins in the dataset are identified by all 3 search engines, while the spectra and peptide inventories benefit more from each of the individual contributions of the different search engines. The spectral library search engine Pepitome increases the overall spectral count totals by 13% through the identification of previously observed spectra that were not identified by the other search engines. The contribution of Pepitome is less in the area of unique peptides and proteins. MS-GF+ contributes a large fraction of all spectral counts (9.4%) and distinct peptides (16.1%).
Figure 2
Figure 2. Impact of peptide-to-spectrum match (PSM) false discovery rate (FDR) threshold at different levels of overall protein FDR on the total protein inventories.
Surprisingly, increased PSM FDR stringency (lower values) increased the number of identifiable proteins. Protein FDR was maintained below 5% by requiring a minimum number of spectral counts for each protein across the dataset. The spectral count minimum requires to maintain a protein FDR below 5% increased with the applied PSM FDR.
Figure 3
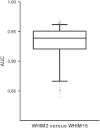
Figure 3. Performance of a 172 protein signature chosen to distinguish proteomic differences between single pairs of basal and luminal breast cancer xenografts.
The protein signature distinguished the two breast tumor subtypes in almost all paired combinations of proteomic datasets generated for the two types of xenografts.
Figure 4
Figure 4. Principal component analysis of LC-MS/MS system performance metrics.
Forty-four metrics from a total of 1,425 LC-MS/MS experiments were collapsed into two principal components, which accounted for 42.5% of the total variation.
Figure 5
Figure 5. Comparison of all TCGA samples with respect to normalized Euclidean distance based on performance metrics and numbers of filtered spectra, distinct peptides and protein groups.
Figure 6
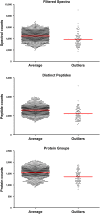
Figure 6. Comparison of protein identification values between LC-MS/MS experiments classified as ‘outlier’ and ‘non-outlier’ based on performance metrics.
The mean values for spectral counts, peptide and protein identification were lower in the analyses classified as outliers.

References

Data Citations

    1. Edwards N., Liebler D. C. 2014. ProteomeXchange . PXD001006
    1. 2014. Broad Institute Firehose TCGA sequence data for colon carcinoma . http://gdac.broadinstitute.org/runs/stddata__2013_05_23/data/COAD/201305...
    1. 2014. Broad Institute Firehose TCGA sequence data for rectal carcinoma . http://gdac.broadinstitute.org/runs/stddata__2013_05_23/data/READ/201305...
    1. Slebos R. J. C., Edwards N. 2015. ProteomeXchange . PXD002041
    1. Slebos R. J. C., Edwards N. 2015. ProteomeXchange . PXD002042

References

    1. Ellis M. J. et al. Connecting genomic alterations to cancer biology with proteomics: the NCI Clinical Proteomic Tumor Analysis Consortium. Cancer Discov. 3, 1108–1112 (2013). - PMC - PubMed
    1. Zhang B. et al. Proteogenomic characterization of human colon and rectal cancer. Nature 513, 382–387 (2014). - PMC - PubMed
    1. TCGA. Comprehensive molecular characterization of human colon and rectal cancer. Nature 487, 330–337 (2012). - PMC - PubMed
    1. Nesvizhskii A. I., Vitek O. & Aebersold R. Analysis and validation of proteomic data generated by tandem mass spectrometry. Nat. Methods 4, 787–797 (2007). - PubMed
    1. Tabb D. L., Fernando C. G. & Chambers M. C. MyriMatch: highly accurate tandem mass spectral peptide identification by multivariate hypergeometric analysis. J. Proteome Res. 6, 654–661 (2007). - PMC - PubMed

Publication types