

Metabolic Profiles in Ovine Carotid Arteries with Developmental Maturation and Long-Term Hypoxia
- PMID: 26110419
- PMCID: PMC4482414
- DOI: 10.1371/journal.pone.0130739
Metabolic Profiles in Ovine Carotid Arteries with Developmental Maturation and Long-Term Hypoxia
Abstract
Background: Long-term hypoxia (LTH) is an important stressor related to health and disease during development. At different time points from fetus to adult, we are exposed to hypoxic stress because of placental insufficiency, high-altitude residence, smoking, chronic anemia, pulmonary, and heart disorders, as well as cancers. Intrauterine hypoxia can lead to fetal growth restriction and long-term sequelae such as cognitive impairments, hypertension, cardiovascular disorders, diabetes, and schizophrenia. Similarly, prolonged hypoxic exposure during adult life can lead to acute mountain sickness, chronic fatigue, chronic headache, cognitive impairment, acute cerebral and/or pulmonary edema, and death.
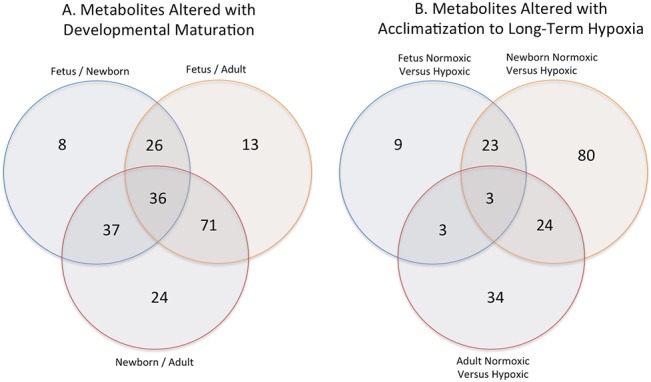
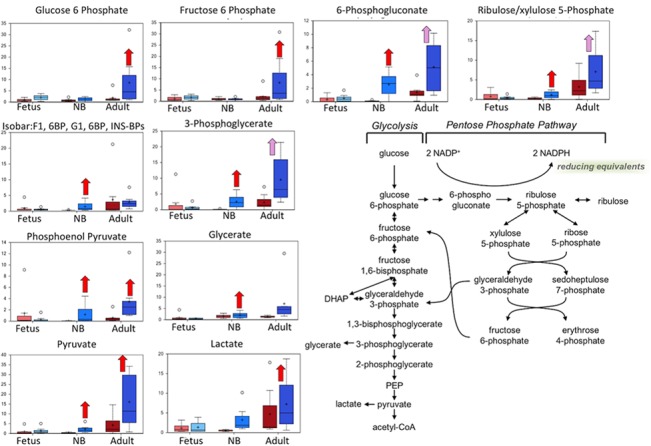
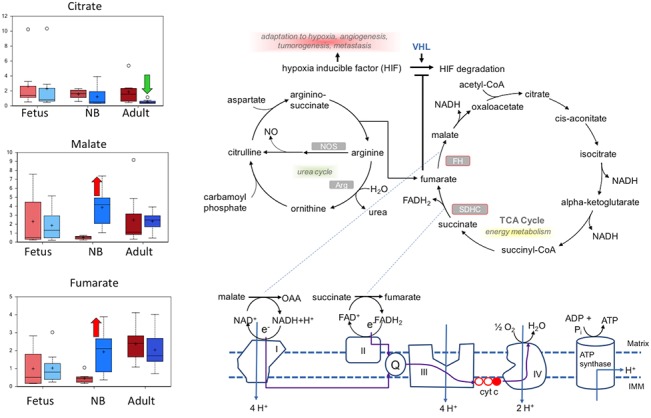
Aim: LTH also can lead to alteration in metabolites such as fumarate, 2-oxoglutarate, malate, and lactate, which are linked to epigenetic regulation of gene expression. Importantly, during the intrauterine life, a fetus is under a relative hypoxic environment, as compared to newborn or adult. Thus, the changes in gene expression with development from fetus to newborn to adult may be as a consequence of underlying changes in the metabolic profile because of the hypoxic environment along with developmental maturation. To examine this possibility, we examined the metabolic profile in carotid arteries from near-term fetus, newborn, and adult sheep in both normoxic and long-term hypoxic acclimatized groups.
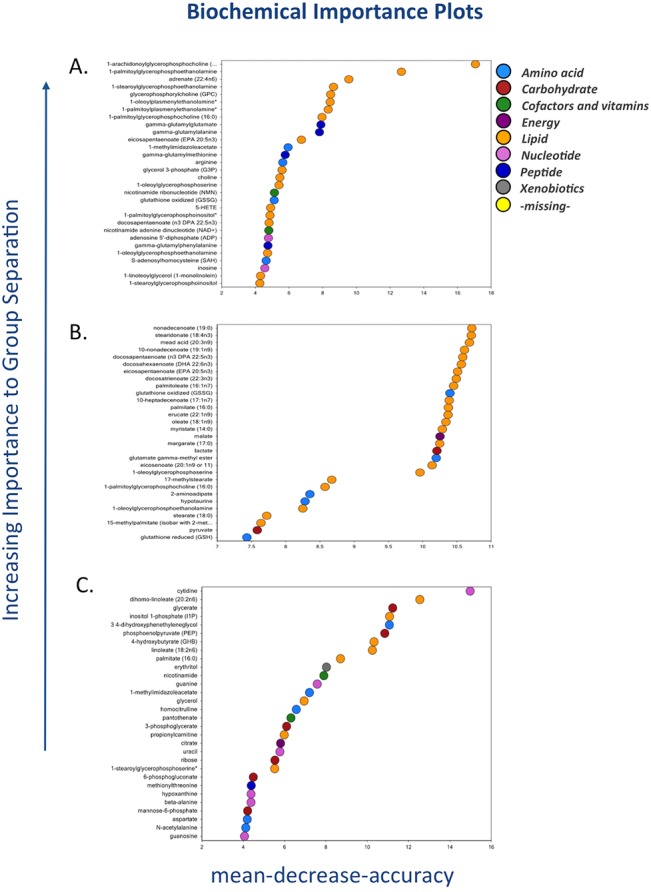
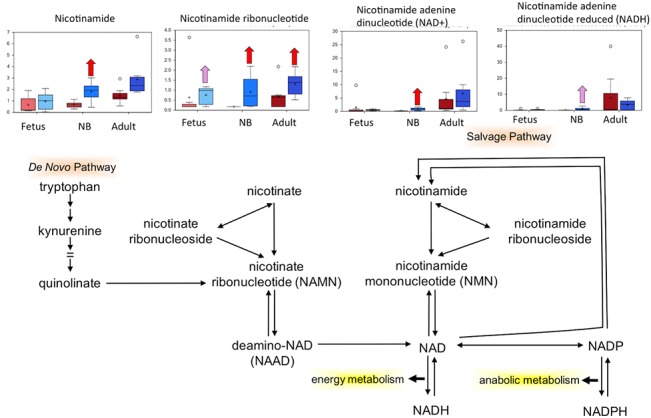
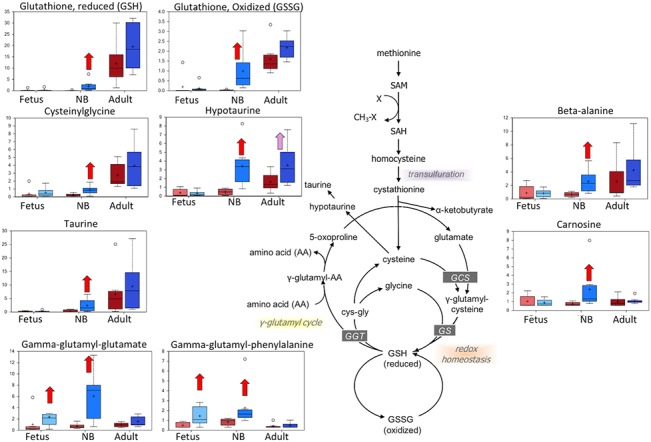
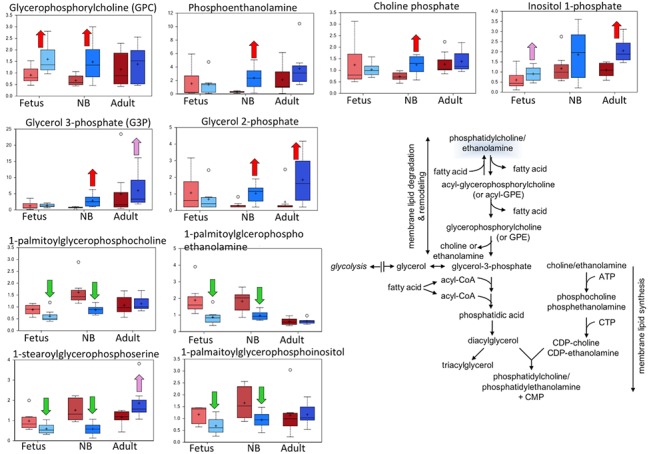
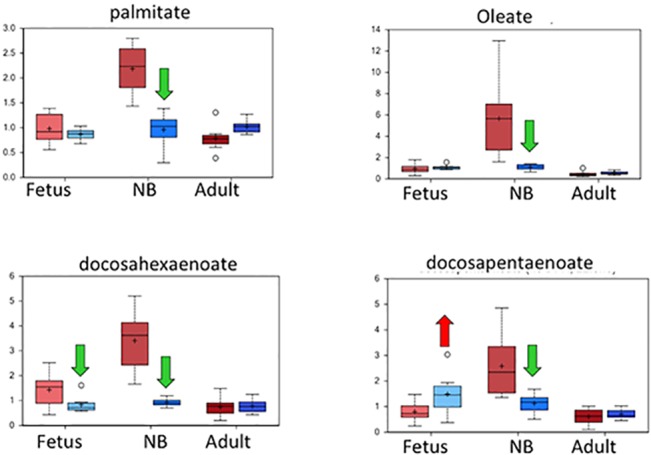
Results: Our results demonstrate that LTH differentially regulated glucose metabolism, mitochondrial metabolism, nicotinamide cofactor metabolism, oxidative stress and antioxidants, membrane lipid hydrolysis, and free fatty acid metabolism, each of which may play a role in genetic-epigenetic regulation.
Conflict of interest statement
Figures
Similar articles
-
Gestational long-term hypoxia induces metabolomic reprogramming and phenotypic transformations in fetal sheep pulmonary arteries.Am J Physiol Lung Cell Mol Physiol. 2021 May 1;320(5):L770-L784. doi: 10.1152/ajplung.00469.2020. Epub 2021 Feb 24. Am J Physiol Lung Cell Mol Physiol. 2021. PMID: 33624555 Free PMC article.
-
Long-Term Gestational Hypoxia Modulates Expression of Key Genes Governing Mitochondrial Function in the Perirenal Adipose of the Late Gestation Sheep Fetus.Reprod Sci. 2015 Jun;22(6):654-63. doi: 10.1177/1933719114561554. Epub 2014 Dec 10. Reprod Sci. 2015. PMID: 25504105 Free PMC article.
-
Antenatal maternal long-term hypoxia: acclimatization responses with altered gene expression in ovine fetal carotid arteries.PLoS One. 2013 Dec 18;8(12):e82200. doi: 10.1371/journal.pone.0082200. eCollection 2013. PLoS One. 2013. PMID: 24367503 Free PMC article.
-
Altitude, attitude and adaptation.Adv Exp Med Biol. 2014;814:147-57. doi: 10.1007/978-1-4939-1031-1_13. Adv Exp Med Biol. 2014. PMID: 25015808 Free PMC article. Review.
-
Pharmacological approaches in either intermittent or permanent hypoxia: A tale of two exposures.Pharmacol Res. 2015 Nov;101:94-101. doi: 10.1016/j.phrs.2015.07.011. Epub 2015 Jul 26. Pharmacol Res. 2015. PMID: 26215469 Review.
Cited by
-
Fetal Cerebral Artery Mitochondrion as Target of Prenatal Alcohol Exposure.Int J Environ Res Public Health. 2019 May 7;16(9):1586. doi: 10.3390/ijerph16091586. Int J Environ Res Public Health. 2019. PMID: 31067632 Free PMC article. Review.
-
Artifacts Introduced by Sample Handling in Chemiluminescence Assays of Nitric Oxide Metabolites.Antioxidants (Basel). 2023 Aug 25;12(9):1672. doi: 10.3390/antiox12091672. Antioxidants (Basel). 2023. PMID: 37759975 Free PMC article.
-
The maturity in fetal pigs using a multi-fluid metabolomic approach.Sci Rep. 2020 Nov 16;10(1):19912. doi: 10.1038/s41598-020-76709-8. Sci Rep. 2020. PMID: 33199811 Free PMC article.
-
Gestational long-term hypoxia induces metabolomic reprogramming and phenotypic transformations in fetal sheep pulmonary arteries.Am J Physiol Lung Cell Mol Physiol. 2021 May 1;320(5):L770-L784. doi: 10.1152/ajplung.00469.2020. Epub 2021 Feb 24. Am J Physiol Lung Cell Mol Physiol. 2021. PMID: 33624555 Free PMC article.
-
Gestational Hypoxia and Programing of Lung Metabolism.Front Physiol. 2019 Nov 29;10:1453. doi: 10.3389/fphys.2019.01453. eCollection 2019. Front Physiol. 2019. PMID: 31849704 Free PMC article. Review.
References
-
- Romero R, Kuivaniemi H, Tromp G, Olson J. The design, execution, and interpretation of genetic association studies to decipher complex diseases. Am J Obstet Gynecol. 2002; 187: 1299–1312. - PubMed
Publication types
MeSH terms
Substances
Grants and funding
LinkOut - more resources
Full Text Sources
Other Literature Sources
