

Better prediction of functional effects for sequence variants
- PMID: 26110438
- PMCID: PMC4480835
- DOI: 10.1186/1471-2164-16-S8-S1
Better prediction of functional effects for sequence variants
Abstract
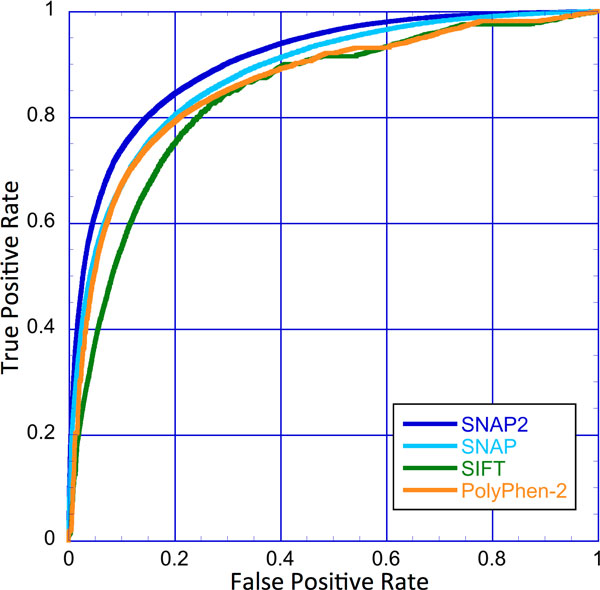
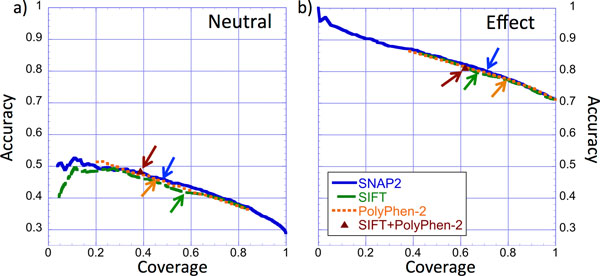
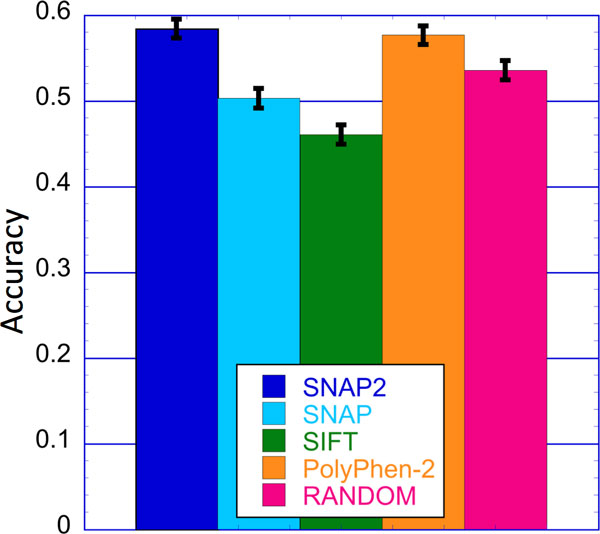
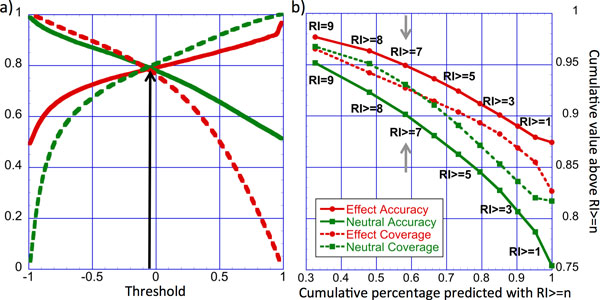
Elucidating the effects of naturally occurring genetic variation is one of the major challenges for personalized health and personalized medicine. Here, we introduce SNAP2, a novel neural network based classifier that improves over the state-of-the-art in distinguishing between effect and neutral variants. Our method's improved performance results from screening many potentially relevant protein features and from refining our development data sets. Cross-validated on >100k experimentally annotated variants, SNAP2 significantly outperformed other methods, attaining a two-state accuracy (effect/neutral) of 83%. SNAP2 also outperformed combinations of other methods. Performance increased for human variants but much more so for other organisms. Our method's carefully calibrated reliability index informs selection of variants for experimental follow up, with the most strongly predicted half of all effect variants predicted at over 96% accuracy. As expected, the evolutionary information from automatically generated multiple sequence alignments gave the strongest signal for the prediction. However, we also optimized our new method to perform surprisingly well even without alignments. This feature reduces prediction runtime by over two orders of magnitude, enables cross-genome comparisons, and renders our new method as the best solution for the 10-20% of sequence orphans. SNAP2 is available at: https://rostlab.org/services/snap2web.
Figures
Similar articles
-
KinMutRF: a random forest classifier of sequence variants in the human protein kinase superfamily.BMC Genomics. 2016 Jun 23;17 Suppl 2(Suppl 2):396. doi: 10.1186/s12864-016-2723-1. BMC Genomics. 2016. PMID: 27357839 Free PMC article.
-
Common sequence variants affect molecular function more than rare variants?Sci Rep. 2017 May 9;7(1):1608. doi: 10.1038/s41598-017-01054-2. Sci Rep. 2017. PMID: 28487536 Free PMC article.
-
Use of estimated evolutionary strength at the codon level improves the prediction of disease-related protein mutations in humans.Hum Mutat. 2008 Jan;29(1):198-204. doi: 10.1002/humu.20628. Hum Mutat. 2008. PMID: 17935148
-
Network-based drug sensitivity prediction.BMC Med Genomics. 2020 Dec 28;13(Suppl 11):193. doi: 10.1186/s12920-020-00829-3. BMC Med Genomics. 2020. PMID: 33371891 Free PMC article.
-
Curated multiple sequence alignment for the Adenomatous Polyposis Coli (APC) gene and accuracy of in silico pathogenicity predictions.PLoS One. 2020 Aug 4;15(8):e0233673. doi: 10.1371/journal.pone.0233673. eCollection 2020. PLoS One. 2020. PMID: 32750050 Free PMC article.
Cited by
-
Variant predictions in congenital adrenal hyperplasia caused by mutations in CYP21A2.Front Pharmacol. 2022 Oct 5;13:931089. doi: 10.3389/fphar.2022.931089. eCollection 2022. Front Pharmacol. 2022. PMID: 36278220 Free PMC article.
-
HGDiscovery: An online tool providing functional and phenotypic information on novel variants of homogentisate 1,2- dioxigenase.Curr Res Struct Biol. 2022 Aug 30;4:271-277. doi: 10.1016/j.crstbi.2022.08.001. eCollection 2022. Curr Res Struct Biol. 2022. PMID: 36118553 Free PMC article.
-
Tools for Predicting the Functional Impact of Nonsynonymous Genetic Variation.Genetics. 2016 Jun;203(2):635-47. doi: 10.1534/genetics.116.190033. Genetics. 2016. PMID: 27270698 Free PMC article. Review.
-
Protein function in precision medicine: deep understanding with machine learning.FEBS Lett. 2016 Aug;590(15):2327-41. doi: 10.1002/1873-3468.12307. Epub 2016 Aug 6. FEBS Lett. 2016. PMID: 27423136 Free PMC article. Review.
-
A New Case of Autosomal-Dominant POLR3B-Related Disorder: Widening Genotypic and Phenotypic Spectrum.Brain Sci. 2023 Nov 8;13(11):1567. doi: 10.3390/brainsci13111567. Brain Sci. 2023. PMID: 38002527 Free PMC article.
References
-
- Cingolani P, Platts A, Wang le L, Coon M, Nguyen T, Wang L, Land SJ, Lu X, Ruden DM. A program for annotating and predicting the effects of single nucleotide polymorphisms, SnpEff: SNPs in the genome of Drosophila melanogaster strain w1118; iso-2; iso-3. Fly. 2012;6(2):80–92. doi: 10.4161/fly.19695. - DOI - PMC - PubMed
Publication types
MeSH terms
Substances
LinkOut - more resources
Full Text Sources
Molecular Biology Databases
Research Materials
