Phylodynamics of H5N1 Highly Pathogenic Avian Influenza in Europe, 2005-2010: Potential for Molecular Surveillance of New Outbreaks
- PMID: 26110587
- PMCID: PMC4488740
- DOI: 10.3390/v7062773
Phylodynamics of H5N1 Highly Pathogenic Avian Influenza in Europe, 2005-2010: Potential for Molecular Surveillance of New Outbreaks
Abstract
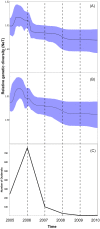
Previous Bayesian phylogeographic studies of H5N1 highly pathogenic avian influenza viruses (HPAIVs) explored the origin and spread of the epidemic from China into Russia, indicating that HPAIV circulated in Russia prior to its detection there in 2005. In this study, we extend this research to explore the evolution and spread of HPAIV within Europe during the 2005-2010 epidemic, using all available sequences of the hemagglutinin (HA) and neuraminidase (NA) gene regions that were collected in Europe and Russia during the outbreak. We use discrete-trait phylodynamic models within a Bayesian statistical framework to explore the evolution of HPAIV. Our results indicate that the genetic diversity and effective population size of HPAIV peaked between mid-2005 and early 2006, followed by drastic decline in 2007, which coincides with the end of the epidemic in Europe. Our results also suggest that domestic birds were the most likely source of the spread of the virus from Russia into Europe. Additionally, estimates of viral dispersal routes indicate that Russia, Romania, and Germany were key epicenters of these outbreaks. Our study quantifies the dynamics of a major European HPAIV pandemic and substantiates the ability of phylodynamic models to improve molecular surveillance of novel AIVs.
Keywords: Bayesian inference; Europe; H5N1; Russia; highly pathogenic avian influenza; phylodynamic models; phylogeography; surveillance.
Figures


Similar articles
-
Genetic evidence for avian influenza H5N1 viral transmission along the Black Sea-Mediterranean Flyway.J Gen Virol. 2016 Sep;97(9):2129-2134. doi: 10.1099/jgv.0.000534. Epub 2016 Jul 20. J Gen Virol. 2016. PMID: 27443670
-
Characterization of H5N1 influenza A virus that caused the first highly pathogenic avian influenza outbreak in Saudi Arabia.J Infect Dev Ctries. 2015 Nov 30;9(11):1210-9. doi: 10.3855/jidc.6546. J Infect Dev Ctries. 2015. PMID: 26623630
-
Multiple introductions of a reassortant H5N1 avian influenza virus of clade 2.3.2.1c with PB2 gene of H9N2 subtype into Indian poultry.Infect Genet Evol. 2016 Sep;43:173-8. doi: 10.1016/j.meegid.2016.05.012. Epub 2016 May 10. Infect Genet Evol. 2016. PMID: 27174088
-
Intracontinental and intercontinental dissemination of Asian H5 highly pathogenic avian influenza virus (clade 2.3.4.4) in the winter of 2014-2015.Rev Med Virol. 2015 Nov;25(6):388-405. doi: 10.1002/rmv.1857. Epub 2015 Oct 13. Rev Med Virol. 2015. PMID: 26458727 Review.
-
(Highly pathogenic) avian influenza as a zoonotic agent.Vet Microbiol. 2010 Jan 27;140(3-4):237-45. doi: 10.1016/j.vetmic.2009.08.022. Epub 2009 Aug 26. Vet Microbiol. 2010. PMID: 19782482 Review.
Cited by
-
Applications of Bayesian Phylodynamic Methods in a Recent U.S. Porcine Reproductive and Respiratory Syndrome Virus Outbreak.Front Microbiol. 2016 Feb 2;7:67. doi: 10.3389/fmicb.2016.00067. eCollection 2016. Front Microbiol. 2016. PMID: 26870024 Free PMC article.
-
Incorporating sampling uncertainty in the geospatial assignment of taxa for virus phylogeography.Virus Evol. 2019 Feb 28;5(1):vey043. doi: 10.1093/ve/vey043. eCollection 2019 Jan. Virus Evol. 2019. PMID: 30838129 Free PMC article.
-
Integrating molecular epidemiology and social network analysis to study infectious diseases: Towards a socio-molecular era for public health.Infect Genet Evol. 2016 Dec;46:248-255. doi: 10.1016/j.meegid.2016.05.042. Epub 2016 Jun 2. Infect Genet Evol. 2016. PMID: 27262354 Free PMC article. Review.
-
Phylogeographic analysis of the full genome of Sweepovirus to trace virus dispersal and introduction to Korea.PLoS One. 2018 Aug 13;13(8):e0202174. doi: 10.1371/journal.pone.0202174. eCollection 2018. PLoS One. 2018. PMID: 30102735 Free PMC article.
-
Novel analytic tools for the study of porcine reproductive and respiratory syndrome virus (PRRSv) in endemic settings: lessons learned in the U.S.Porcine Health Manag. 2016 Jan 21;2:3. doi: 10.1186/s40813-016-0019-0. eCollection 2016. Porcine Health Manag. 2016. PMID: 28405429 Free PMC article. Review.
References
Publication types
MeSH terms
Substances
LinkOut - more resources
Full Text Sources
Other Literature Sources
Medical

