. 2015 Jun 25;10(6):e0130088.
doi: 10.1371/journal.pone.0130088. eCollection 2015.

L-Amino Acids Elicit Diverse Response Patterns in Taste Sensory Cells: A Role for Multiple Receptors

Affiliations

L-Amino Acids Elicit Diverse Response Patterns in Taste Sensory Cells: A Role for Multiple Receptors

Shreoshi Pal Choudhuri et al. PLoS One. .

Abstract

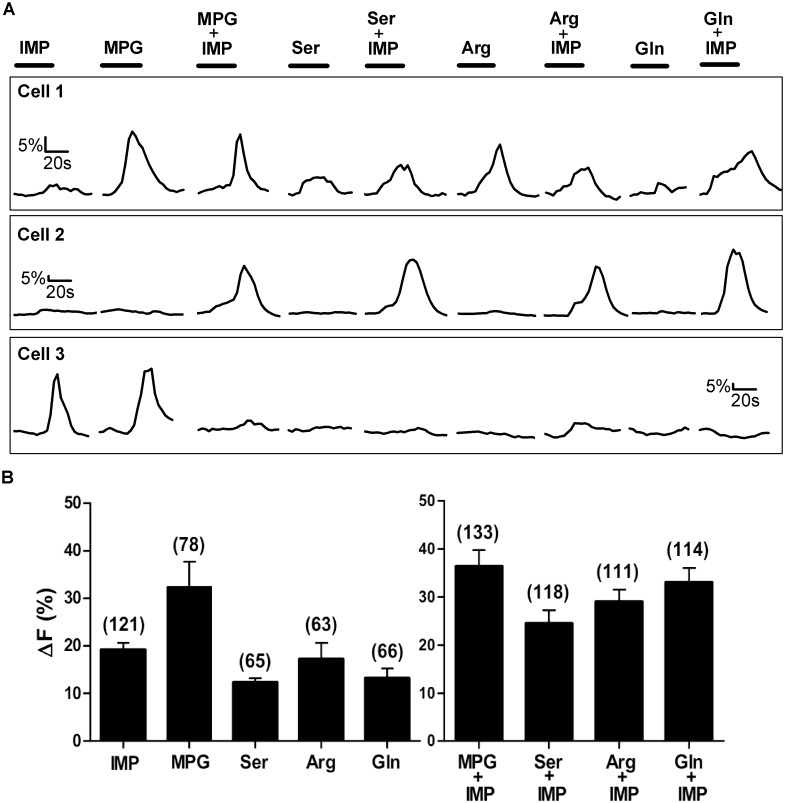
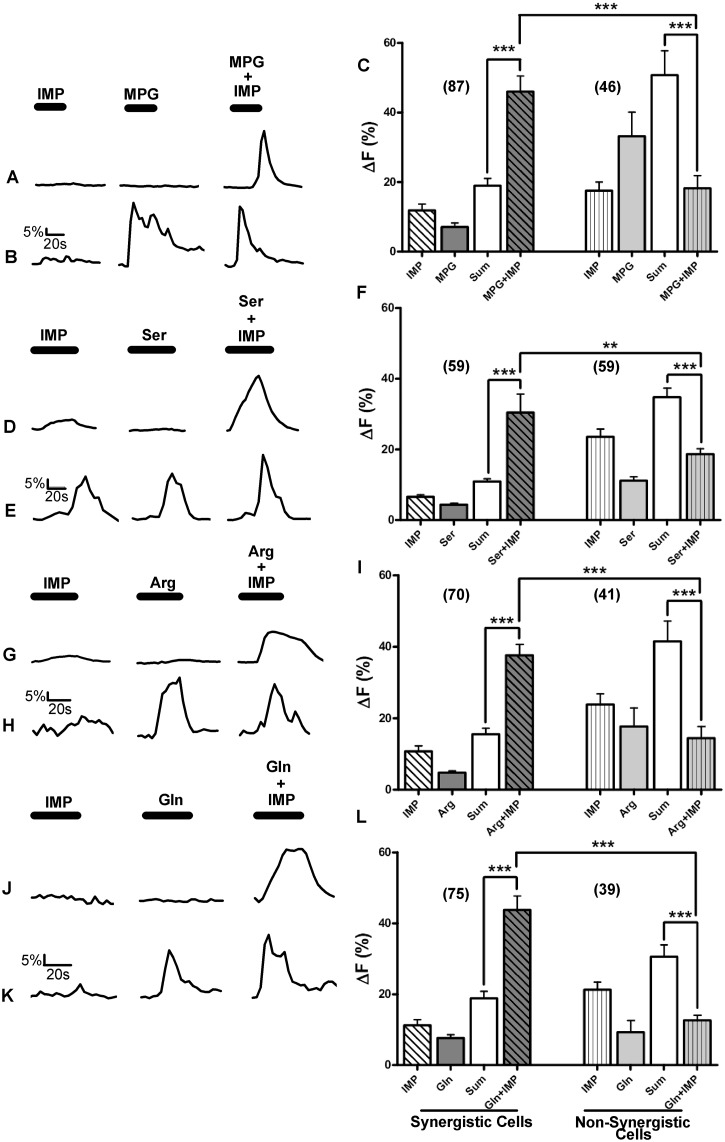
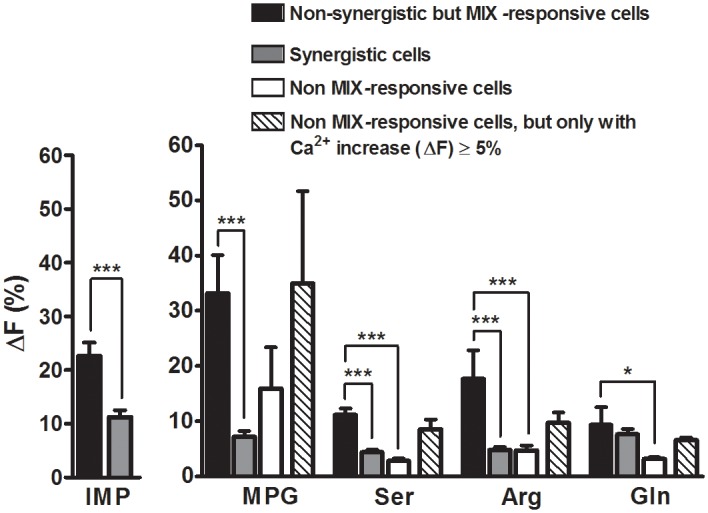
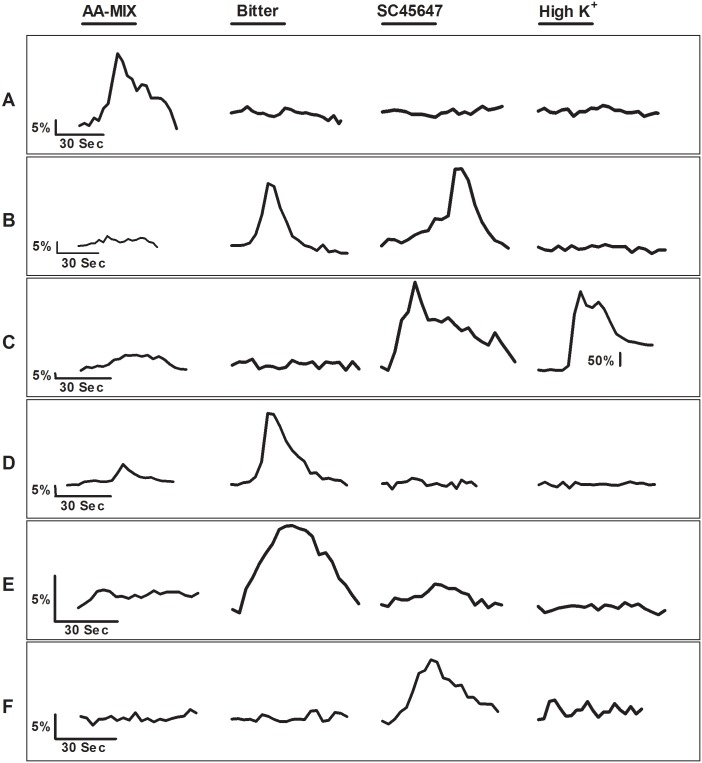
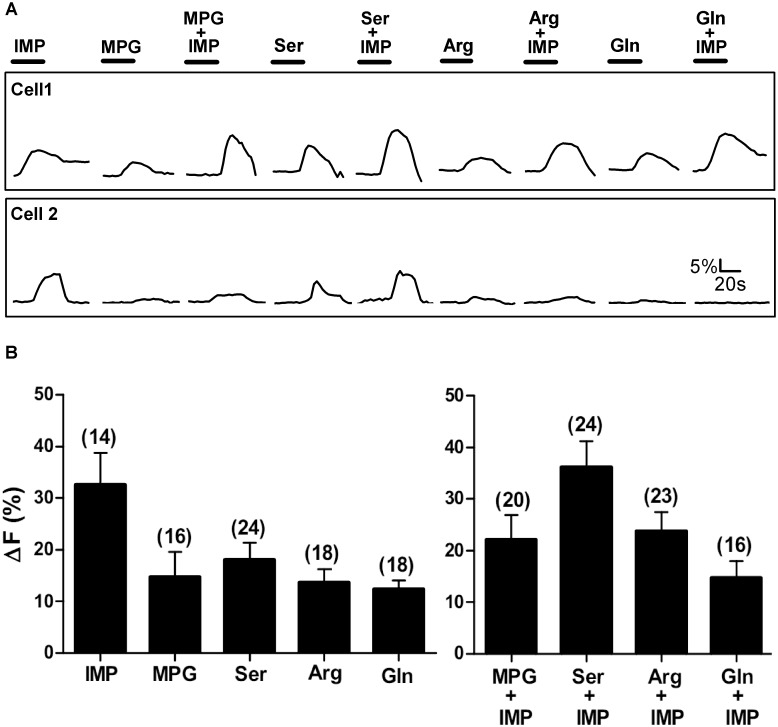
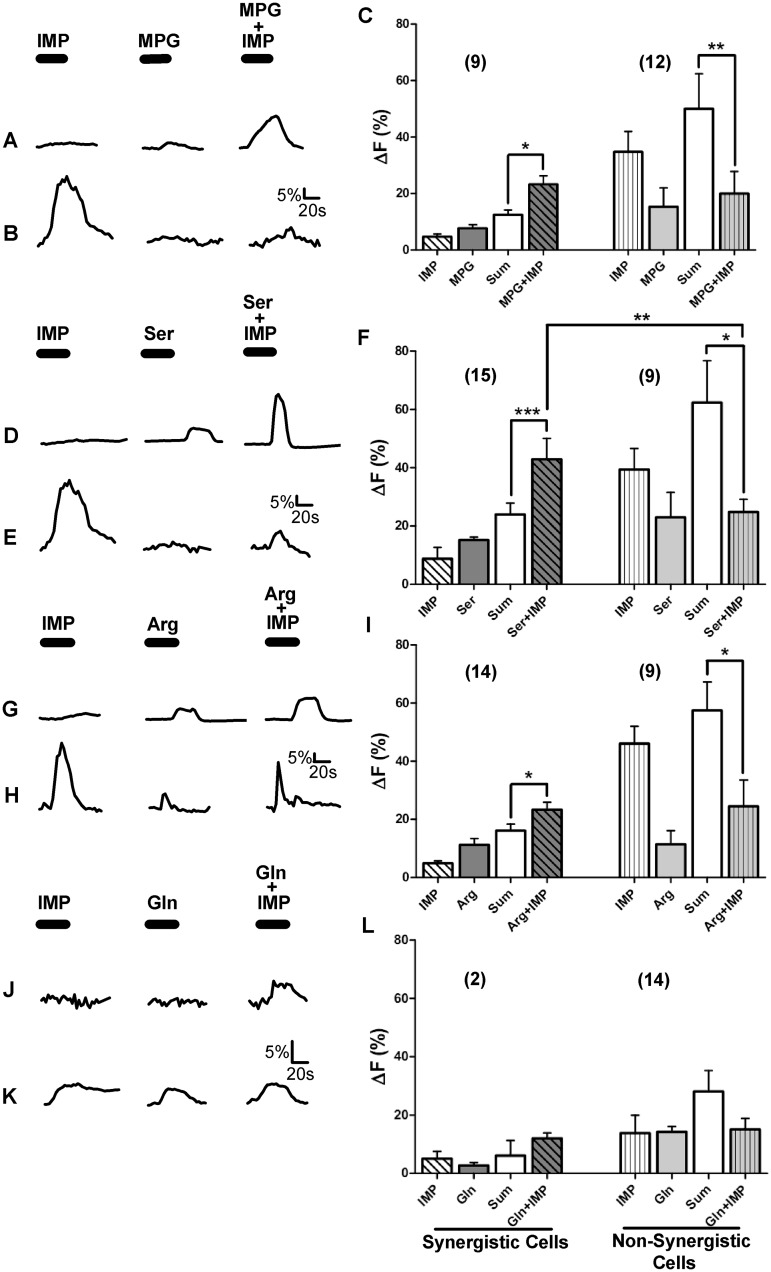
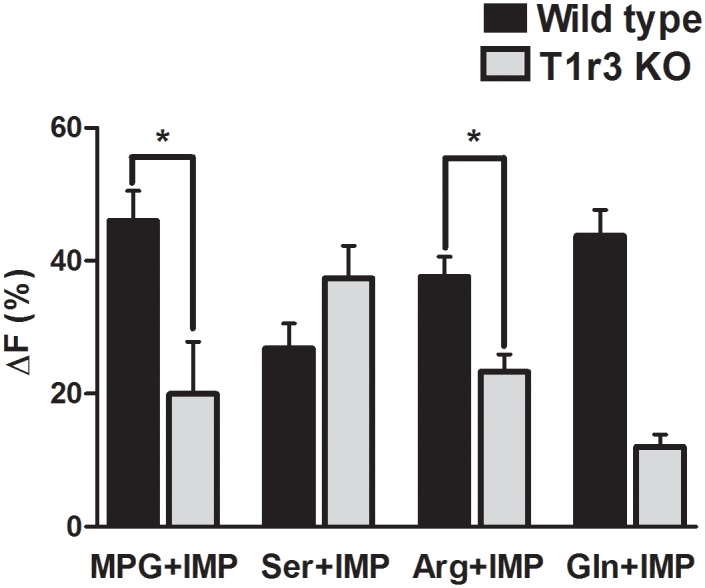
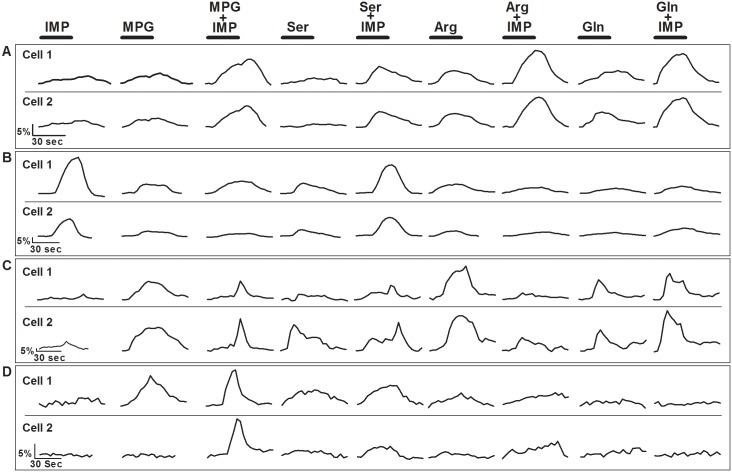
Umami, the fifth basic taste, is elicited by the L-amino acid, glutamate. A unique characteristic of umami taste is the response potentiation by 5' ribonucleotide monophosphates, which are also capable of eliciting an umami taste. Initial reports using human embryonic kidney (HEK) cells suggested that there is one broadly tuned receptor heterodimer, T1r1+T1r3, which detects L-glutamate and all other L-amino acids. However, there is growing evidence that multiple receptors detect glutamate in the oral cavity. While much is understood about glutamate transduction, the mechanisms for detecting the tastes of other L-amino acids are less well understood. We used calcium imaging of isolated taste sensory cells and taste cell clusters from the circumvallate and foliate papillae of C57BL/6J and T1r3 knockout mice to determine if other receptors might also be involved in detection of L-amino acids. Ratiometric imaging with Fura-2 was used to study calcium responses to monopotassium L-glutamate, L-serine, L-arginine, and L-glutamine, with and without inosine 5' monophosphate (IMP). The results of these experiments showed that the response patterns elicited by L-amino acids varied significantly across taste sensory cells. L-amino acids other than glutamate also elicited synergistic responses in a subset of taste sensory cells. Along with its role in synergism, IMP alone elicited a response in a large number of taste sensory cells. Our data indicate that synergistic and non-synergistic responses to L-amino acids and IMP are mediated by multiple receptors or possibly a receptor complex.


Conflict of interest statement

Competing Interests: The authors have declared that no competing interests exist.

Figures

Fig 1
Fig 1. Representative Ca2+ responses of TSCs from WT mice.
Stimuli tested were IMP (1mM), 4 L-amino acids from different side-chain groups (MPG (10mM), Ser (20mM), Arg (10mM), and Gln (10mM)), and L-amino acids with IMP. [A] Ca2+ responses of 3 sample TSCs. Each cell was tested with all 9 stimuli. The responses of the three cells are examples of some of the different response patterns to the array of stimuli. The bar above each stimulus trace represents stimulus application time (30 sec). [B] Mean±SEM amplitude of Ca2+ increase above baseline for responsive cells only, i.e. cells with a change in Ca2+ ≥5%. Numbers in parenthesis are the number of cells.
Fig 2
Fig 2. Some but not all TSCs generated synergistic response to the L-amino acid+IMP MIXes.
Ca2+ responses of WT TSCs to the four L-amino acid sets are shown. Each L-amino acid set consisted of one of the four different L-amino acids (MPG (10mM), Ser (20mM), Arg (10mM), or Gln (10mM), respectively), IMP (1mM), and the MIX of L-amino acid+IMP. [A, D, G, J] Representative TSC responses where the magnitudes of MIX responses were greater than the summation of individual L-amino acid and IMP responses, i.e., the MIX responses were synergistic. [B, E, H, I] Representative TSC responses where the magnitudes of MIX responses were greater than or equal to the responses of the L-amino acid or IMP individually, but not greater than the summation of individual L-amino acid and IMP responses, i.e., the MIX responses were not synergistic. [C, F, I, L] A Mean±SEM response for the L-amino acid sets exhibiting synergistic and non-synergistic responses. For each L-amino acid set, the MIX responses generated by synergistic cells were significantly greater than the calculated sum (Sum) of L-amino acid and IMP responses. For non-synergistic cells, MIX responses were significantly smaller than the calculated sums of responses to L-amino acid and IMP. MIX responses of synergistic cells were also significantly greater than the MIX responses of non-synergistic cells. Numbers in parenthesis are the number of cells. One-way ANOVA followed by Bonferroni post hoc tests were used for statistical comparisons. ***P<0.0001, **P<0.001.
Fig 3
Fig 3. Ca2+ responses to L-amino acids and IMP in MIX-responsive and non-MIX-responsive cells.
Bars represent Mean±SEM Ca2+ responses. Average Ca2+ responses to the individual stimulus components of the MIX were compared for two groups of MIX-responsive cells: 1) non-synergistic and 2) synergistic cells. The increases in intracellular Ca2+ in response to IMP and the L-amino acids were significantly smaller for synergistic cells (gray bars) compared to non-synergistic (black bars) MIX-responsive cells. Cells that did not respond to the MIX but responded to an L-amino acid (non-MIX-responsive cells; white bars) presented alone also generated Ca2+ responses with a similar magnitude as those of MIX-responsive non-synergistic cells (gray bars). To eliminate bias by cells that may not have a receptor, only those cells with Ca2+ responses (ΔF≥5%) to L-amino acids were analyzed (see results). For these cells, Ca2+ responses to individual L-amino acids were not significantly different from Ca2+ responses of MIX-responsive, non-synergistic cells (patterned bars). Unpaired t-test (for IMP), and One-way ANOVA followed by Bonferroni post hoc t-test (for L-amino acids) were used for statistical comparison. ***P<0.0001, **P<0.001, *P<0.05.
Fig 4
Fig 4. Representative Ca2+ responses elicited by TSCs during stimulation with 4 different stimuli.
Cells were stimulated with 4 different stimuli, L-amino acid MIX (AA-MIX) (MPG (10mM), Ser (20mM), Arg (10mM), and Gln (10 mM)), sweet (SC45647 (100μM)), bitter (denatonium (2mM) or cycloheximide (20μM)+denatonium (2mM)), and high-K+ (65mM) solution. The bar above each stimulus trace represents the 30 s stimulus application period. [A] A TSC that responded only to AA-MIX. [B] A TSC that responded to bitter and sweet stimuli. [C] A TSC that responded to AA-MIX, sweet, and high-K+ solution. AA-MIX elicited a very small increase in cytosolic Ca2+ compared to sweet stimulus. The high-K+ solution elicited very large increase in cytosolic Ca2+, suggesting the presence to voltage-gated calcium channels. Note: A different Y axis scale was used for the high-K+ response as the high-K+ elicited response was much larger compared to AA-MIX or sweet responses. [D] This TSC responded to both AA-MIX and bitter stimuli. AA-MIX elicited a very small increase in cytosolic Ca2+ compared to bitter stimulus. [E] This TSC responded only to bitter stimuli. [F] This TSC responded only to sweet stimuli.
Fig 5
Fig 5. Representative Ca2+ responses of TSCs from T1r3 KO mice.
Stimuli tested were IMP (1mM), 4 different L-amino acids (MPG (10mM), Ser (20mM), Arg (10mM), and Gln (10mM)), and L-amino acids with IMP. [A] Ca2+ responses of 2 sample TSCs. Each cell was tested with all 9 stimuli. The responses of these cells are examples of some of the different response patterns elicited by the array of stimuli. The bar above each stimulus trace represents the stimulus application time (30 sec). [B] Mean±SEM amplitude of Ca2+ increase (ΔF%) above baseline for responsive cells only, i.e. only cells with a change in baseline Ca2+≥5%. Numbers in parenthesis are the number of cells.
Fig 6
Fig 6. TSCs from T1r3 KO mice can also elicit synergistic responses.
Ca2+ responses of T1r3 KO TSCs to the four L-amino acid sets are shown. Each L-amino acid set consisted of one of the four L-amino acids (MPG (10mM), Ser (20mM), Arg (10mM), or Gln (10mM), respectively), IMP (1mM), and the MIX of L-amino acid+IMP. [A, D, G, J] Representative TSC responses when the magnitudes of MIX responses were greater than the summation of individual L-amino acid and IMP responses, i.e., the MIX responses were synergistic. [B, E, H, I] Representative TSC responses where the magnitudes of MIX responses were greater than or equal to the response of the L-amino acid or IMP individually, but not greater than the summation of the individual L-amino acid and IMP responses, i.e., the MIX responses were not synergistic. [C, F, I, L] Mean±SEM response for the L-amino acid sets exhibiting synergistic and non-synergistic responses. We were unable to conclude anything about Gln set as only 2 cells responded synergistically to Gln+IMP. Numbers in parenthesis are the number of cells. Mann Whitney test was used for statistical testing. ***P<0.001, **P<0.01, *P<0.05.
Fig 7
Fig 7. Comparison of amplitude of synergistic responses between WT and T1r3 KO mice.
Bars represent Mean±SEM for synergistic responses (i.e., responses to the MIX that were greater than the sum of individual responses) of TSCs from WT and T1r3 KO mice. The amplitude of responses elicited by MPG+IMP and Arg+IMP was significantly smaller in T1r3 KO cells than those of WT cells (Unpaired t-test). *P<0.05.
Fig 8
Fig 8. Representative Ca2+ responses of adjacent WT TSCs in clusters.
Cells were stimulated with 9 different stimuli: IMP (1mM) 4 different L-amino acids (MPG (10mM), Ser (20mM), Arg (10mM), and Gln (10mM)), and L-amino acid+IMP. The bar above each stimulus trace represents the stimulus application time (30 sec). [A] Cells 1 and 2, adjacent TSCs in a cluster, generated Ca2+ responses similar in temporal and amplitude to each stimulus, including synergistic responses to all the L-amino acid+IMP MIXes. [B] These cells were adjacent TSCs in a cluster, exhibited similar non-synergistic Ca2+ responses to all the L-amino acid+IMP MIXes, but the response amplitudes of cell 2 was 50% of cell 1. [C] Cells 1 and 2 were adjacent TSCs in a cluster that responded to the same stimuli. However, one cell responded synergistically to the MIXes whereas the other cell responded non-synergistically. [D] Cells 1 and 2 were adjacent TSCs. Each cell exhibited different response patterns to the array of test stimuli.

Similar articles

Cited by

References

    1. Beauchamp GK, Bertino M, Engelman K. Modification of salt taste. Annals of internal medicine. 1983;98(5 Pt 2):763–9. - PubMed
    1. Bertino M, Beauchamp GK, Engelman K. Long-term reduction in dietary sodium alters the taste of salt. The American journal of clinical nutrition. 1982;36(6):1134–44. - PubMed
    1. DeMet E, Stein MK, Tran C, Chicz-DeMet A, Sangdahl C, Nelson J. Caffeine taste test for panic disorder: adenosine receptor supersensitivity. Psychiatry research. 1989;30(3):231–42. - PubMed
    1. Dess NK, Edelheit D. The bitter with the sweet: the taste/stress/temperament nexus. Biological psychology. 1998;48(2):103–19. - PubMed
    1. Fabbi F. Gustatory sense modifications in diabetes. Archiv fur Ohren-, Nasen- und Kehlkopfheilkunde, vereinigt mit Zeitschrift fur Hals-, Nasen- und Ohrenheilkunde. 1954;164(6):543–6. - PubMed

Publication types