. 2015 Jun 25;10(6):e0131118.
doi: 10.1371/journal.pone.0131118. eCollection 2015.

Prominent vessel sign on susceptibility-weighted imaging in acute stroke: prediction of infarct growth and clinical outcome

Affiliations

Prominent vessel sign on susceptibility-weighted imaging in acute stroke: prediction of infarct growth and clinical outcome

Chia-Yuen Chen et al. PLoS One. .

Abstract

Background and purpose: Predicting the risk of further infarct growth in stroke patients is critical to therapeutic decision making. We aimed to predict early infarct growth and clinical outcome from prominent vessel sign (PVS) identified on the first susceptibility-weighted image (SWI) after acute stroke.

Materials and methods: Twenty-two patients with middle cerebral artery (MCA) infarction had diffusion-weighted imaging, SWI, MR angiography, and clinical evaluation using the National Institutes of Health Stroke Scale at 7-60 hours and 5-14 days after stroke onset. Late-stage clinical evaluation at 1 and 3 months used the modified Rankin Scale. The infarct area and growth were scored from 10 (none) to 0 (infarct or growth in all 10 zones) using the Alberta Stroke Program Early CT Score (ASPECTS) system.

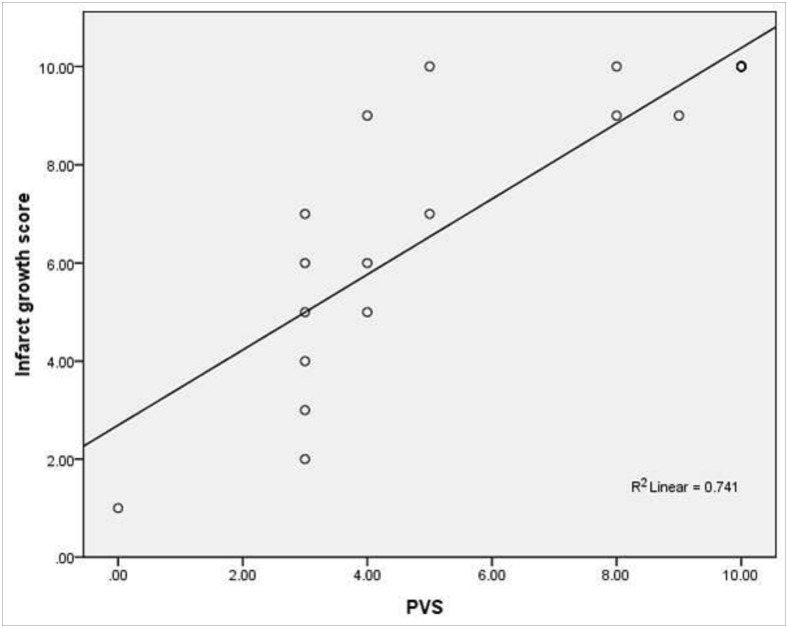
Results: Infarct growth on the second MRI occurred in 13 of 15 patients with PVS on the first MRI and not in any patient without PVS (n=7; r=0.86, P<0.001). The extent of PVS was significantly correlated with infarct growth (r=0.82, P<0.001) and early-stage outcome (P=0.02). No between-group difference in late-stage clinical outcome was found.

Conclusion: PVS on the first SWI after acute MCA territory stroke is a useful predictor of early infarct growth. Extensive PVS within the large MCA territory is related to poor early-stage outcome and could be useful for clinical assessment of stroke.


Conflict of interest statement

Competing Interests: The authors have declared that no competing interests exist.

Figures

Fig 1
Fig 1. A 63-year-old woman had a diagnosis of left middle cerebral artery territory infarct.
The infarct was noted in all 10 zones on diffusion-weighted or susceptibility-weighted magnetic resonance imaging with ASPECTS score = 0. Diffusion-weighted imaging (A,B) at the basal ganglion and suprabasal ganglion levels reveals the infarct in the internal capsule, lentiform nucleus, caudate nucleus, and zones M3, M4, and M5 of the middle cerebral artery. Susceptibility-weighted imaging reveals prominent hypointense cortical and medullary vessels diffusely seen in the insula and M1 to M6 zones of the left middle cerebral artery territory. Engorged deep veins and thalamostriate artery over the lesion side compared with the healthy side were also noted. Involved M1 to M6 zones and insula lost 7 points and an engorged thalamostriate vein lost 3 points. The prominent vessel sign score was 0 (10–7–3 = 0). Susceptibility-weighted imaging (C, D) at the basal ganglion and suprabasal ganglion levels reveals prominent vessel signs in the cortical veins (arrows), medullary veins (arrows) and thalamostriate vein (arrowhead).
Fig 2
Fig 2. Same patient as in Fig 1 The second diffusion-weighted imaging study reveals new or larger infarct areas in the internal capsule, insula, lentiform nuclei, and zones M1 to M6.
The infarct growth score was 1 (10–3–6 = 1). The second diffusion-weighted image (A, B) at the basal ganglion and suprabasal ganglion levels reveals infarct growth in the insula and zones M1 to M6.
Fig 3
Fig 3. Correlation between prominent vessel sign (PVS) score on the first magnetic resonance image and infarct growth score (n = 22, r = 0.86, P<0.001).
Fig 4
Fig 4. Late-stage outcome at 30 days according to the score on the modified Rankin Scale (n = 22, r = –0.22).
P group (n = 12), with PVS score <8. N group (n = 10), with PVS score ≥8.

References

    1. Cho KH, Kwon SU, Lee DH, Shim W, Choi C, Kim SJ, et al. A Early infarct growth predicts long-term clinical outcome after thrombolysis. J Neurol Sci 2012;316:99–103 10.1016/j.jns.2012.01.015 - DOI - PubMed
    1. Sobesky J, Zaro Weber O, Lehnhardt FG, Hesselmann V, Neveling M, Jacobs A, et al. Does the mismatch match the penumbra? MRI and PET in early ischemic stroke. Stroke 2005;36:980–5 - PubMed
    1. Heiss WD. Ischemic penumbra: evidence from functional imaging in man. J Cereb Blood Flow Metab 2000;20:1276–93 - PubMed
    1. Rosso C, Hevia-Montiel N, Deltour S, Bardinet E, Dormont D, Crozier S, et al. Prediction of Infarct growth based on apparent diffusion coefficients: penumbral assessment without intravenous contrast material. Radiology 2009;250:184–92 10.1148/radiol.2493080107 - DOI - PubMed
    1. Wechsler LR. Imaging evaluation of acute ischemic stroke. Stroke 2011;42:S12–S15 10.1161/STROKEAHA.110.599555 - DOI - PubMed

Publication types