doi: 10.5888/pcd12.150187.
How Do You Know Which Health Care Effectiveness Research You Can Trust? A Guide to Study Design for the Perplexed
Affiliations
- PMID: 26111157
- PMCID: PMC4492215
- DOI: 10.5888/pcd12.150187
Item in Clipboard
How Do You Know Which Health Care Effectiveness Research You Can Trust? A Guide to Study Design for the Perplexed
Prev Chronic Dis.
.
No abstract available
Figures

Healthy user bias, a type of selection bias, is demonstrated in a study of 3,415 patients with pneumonia (and at high risk for flu and its complications), where elderly flu vaccine recipients were already healthier than nonrecipients. Figure is based on data extracted from Eurich et al (13). [Table: see text]

A weak cohort study comparing the risk of death or hospitalization for pneumonia or flu among vaccinated versus unvaccinated elderly: example of failure to control for healthy users. Figure is based on data extracted from Nichol et al (15).

Healthy user bias: a strong controlled study disproving the effects of the flu vaccine on all-cause mortality in the elderly during the flu “off season” (control period). The cohort study compared vaccinated elderly and unvaccinated elderly. Figure is based on data extracted from Campitelli et al (17).

Example of selection bias: underlying differences between groups of medical providers show how they are not comparable in studies designed to compare providers using EHRs with providers not using EHRs. Figure is based on data extracted from Simon et al (23) and Decker et al (24). Abbreviation: EHR, electronic health record. [Table: see text]

Example of weak post-only cross-sectional study that did not control for selection bias: the study observed differences between practices with EHRs and practices with paper records after the introduction of EHRs but did not control for types of providers adopting EHRs. Note the unlikely outcome for nonsmoker. Figure is based on data extracted from Cebul et al (26). Abbreviations: BMI, body mass index; EHR, electronic health record. [Table: see text]

Differences in patient characteristics between EHR-based practices and paper-based practices in a weak post-only cross-sectional study that did not control for selection bias. Abbreviation: EHR, electronic health record. Figure is based on data extracted from Cebul et al (26). [Table: see text]

Randomized controlled trial: the “gold standard” of research design.
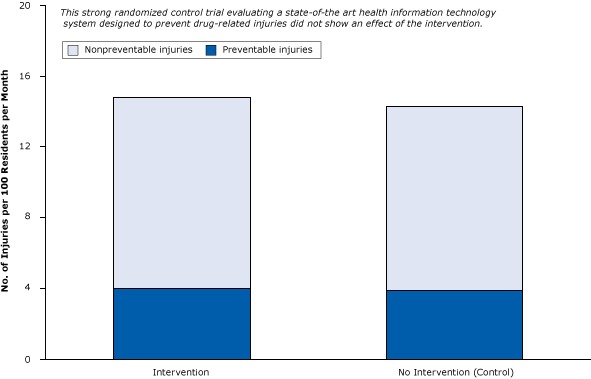
A strong randomized controlled trial of the effect of health information technology on the prevention of drug-related injuries among nursing home residents. Intervention participants received computerized warnings about unsafe combinations of drugs. Figure is based on data extracted from Gurwitz et al (30). [Table: see text]

Elderly people who begin benzodiazepine therapy (recipients) are already sicker and more prone to fractures than nonrecipients. Figure is based on data extracted from Luijendijk et al (35). [Table: see text]
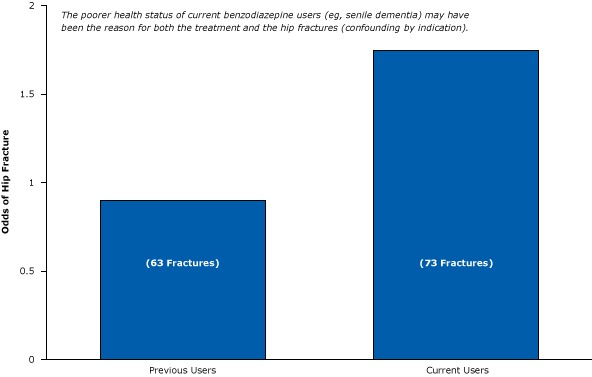
Weak post-only epidemiological study suggesting that current users of benzodiazepines are more likely than previous users to have hip fractures. Figure is based on data extracted from Ray et al (32).

Several examples of effects that can be detected in interrupted time-series studies. The blue bar represents an intervention.
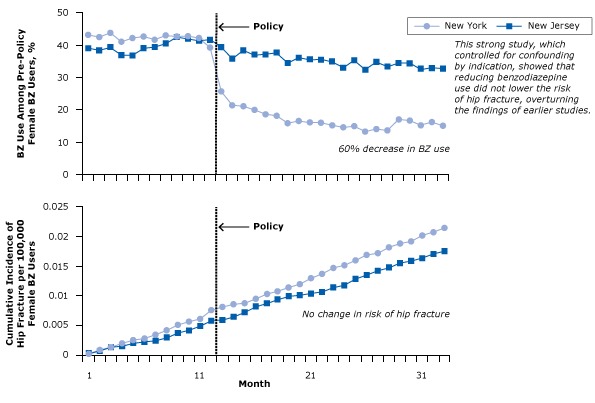
Benzodiazepine (BZ) use and risk of hip fracture among women with Medicaid before and after regulatory surveillance restricting BZ use in New York State. A BZ user was defined as a person who had received at least 1 dispensed BZ in the year before the policy. Figure was adapted from Wagner et al (33). Reprinted with the permission of American College of Physicians, Inc.

Underreporting of calories and fat consumption due to social desirability among women and men. Figure is based on data extracted from Hebert et al (38). Fat intake was measured as the absolute percentage change for every 1% change in social desirability bias. The zero-line indicates no underreporting. [Table: see text]

Study that contaminated intervention group by unwittingly tipping parents off to the socially desired outcome: fewer hours of television time per day for children. Figure is based on data extracted from Taveras et al (40). [Table: see text]
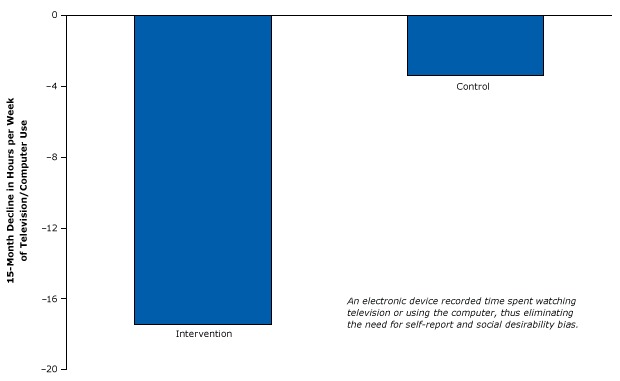
Strong randomized controlled trial design using an electronic device that caused an involuntary reduction in television and computer use. The difference in decline in viewing between the intervention group and control group was significant. Figure is based on data extracted from Epstein et al (42).

Percentage of acute myocardial infarction patients who received essential life-saving drugs (β blockers and thrombolytics) and a drug linked with increased mortality (lidocaine) in control hospitals before and after an intervention. Figure is based on data extracted from Soumerai et al (43).

Example of a weak post-only study of a hospital safety program and mortality that did not control for history. Narrow bar shows start of quality of care program. There is no evidence that data are available for the years leading up to the program. The study did not define the intervention period other than to state that planning occurred in 2003. Figure is based on data extracted from Pryor et al (45). Abbreviation: FY, fiscal year. [Table: see text]

Example of a strong time-series design that controlled for history bias in the Institute for Healthcare Improvement’s 100,000 Lives Campaign. Figure is based on data from the Agency for Healthcare Research and Quality (48). [Table: see text]
References
-
- Krieger N, Löwy I, Aronowitz R, Bigby J, Dickersin K, Garner E, et al. Hormone replacement therapy, cancer, controversies, and women’s health: historical, epidemiological, biological, clinical, and advocacy perspectives. J Epidemiol Community Health 2005;59(9):740–8. 10.1136/jech.2005.033316 - DOI - PMC - PubMed
Publication types
MeSH terms
Substances
LinkOut - more resources
Full Text Sources
Other Literature Sources