

Self-Organizing Feature Maps Identify Proteins Critical to Learning in a Mouse Model of Down Syndrome
- PMID: 26111164
- PMCID: PMC4482027
- DOI: 10.1371/journal.pone.0129126
Self-Organizing Feature Maps Identify Proteins Critical to Learning in a Mouse Model of Down Syndrome
Abstract
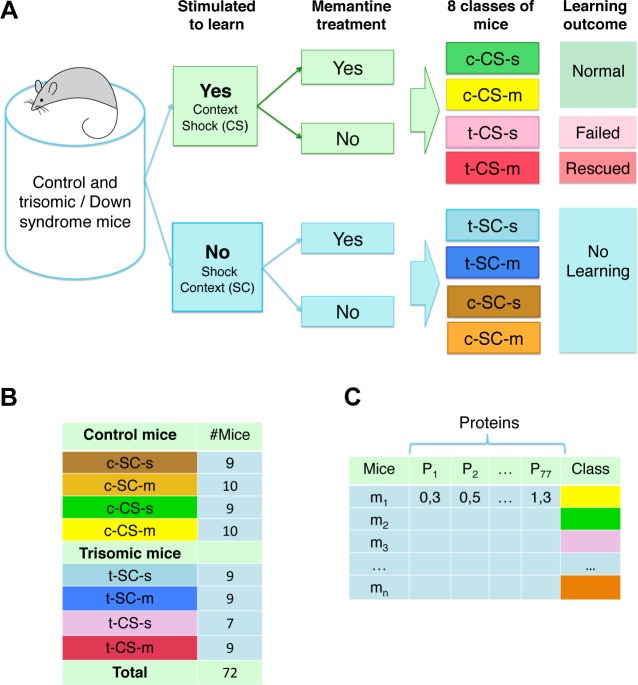
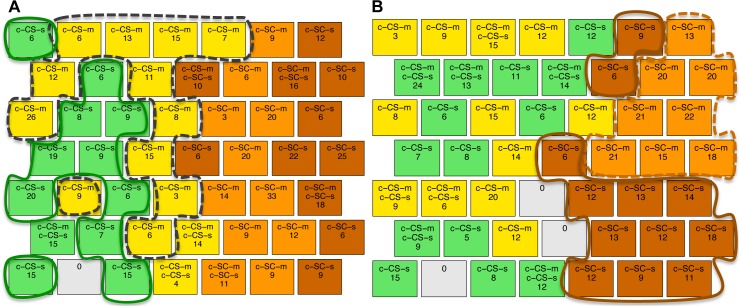
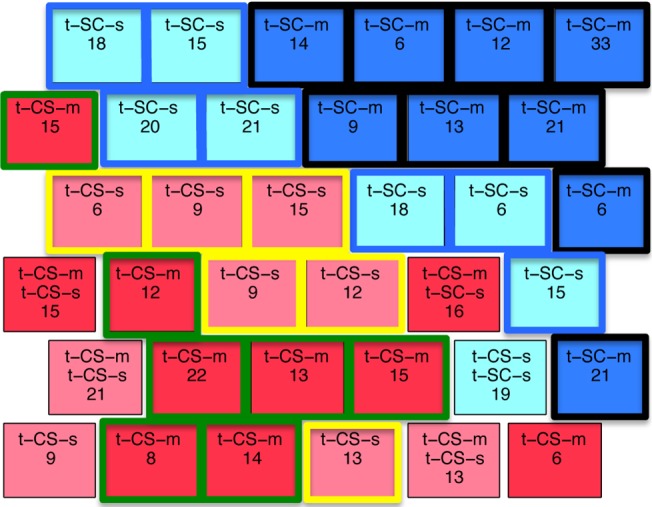
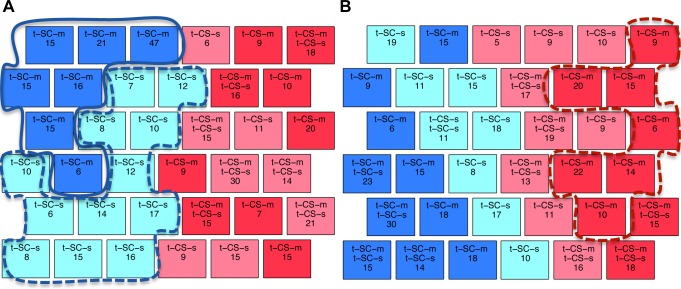
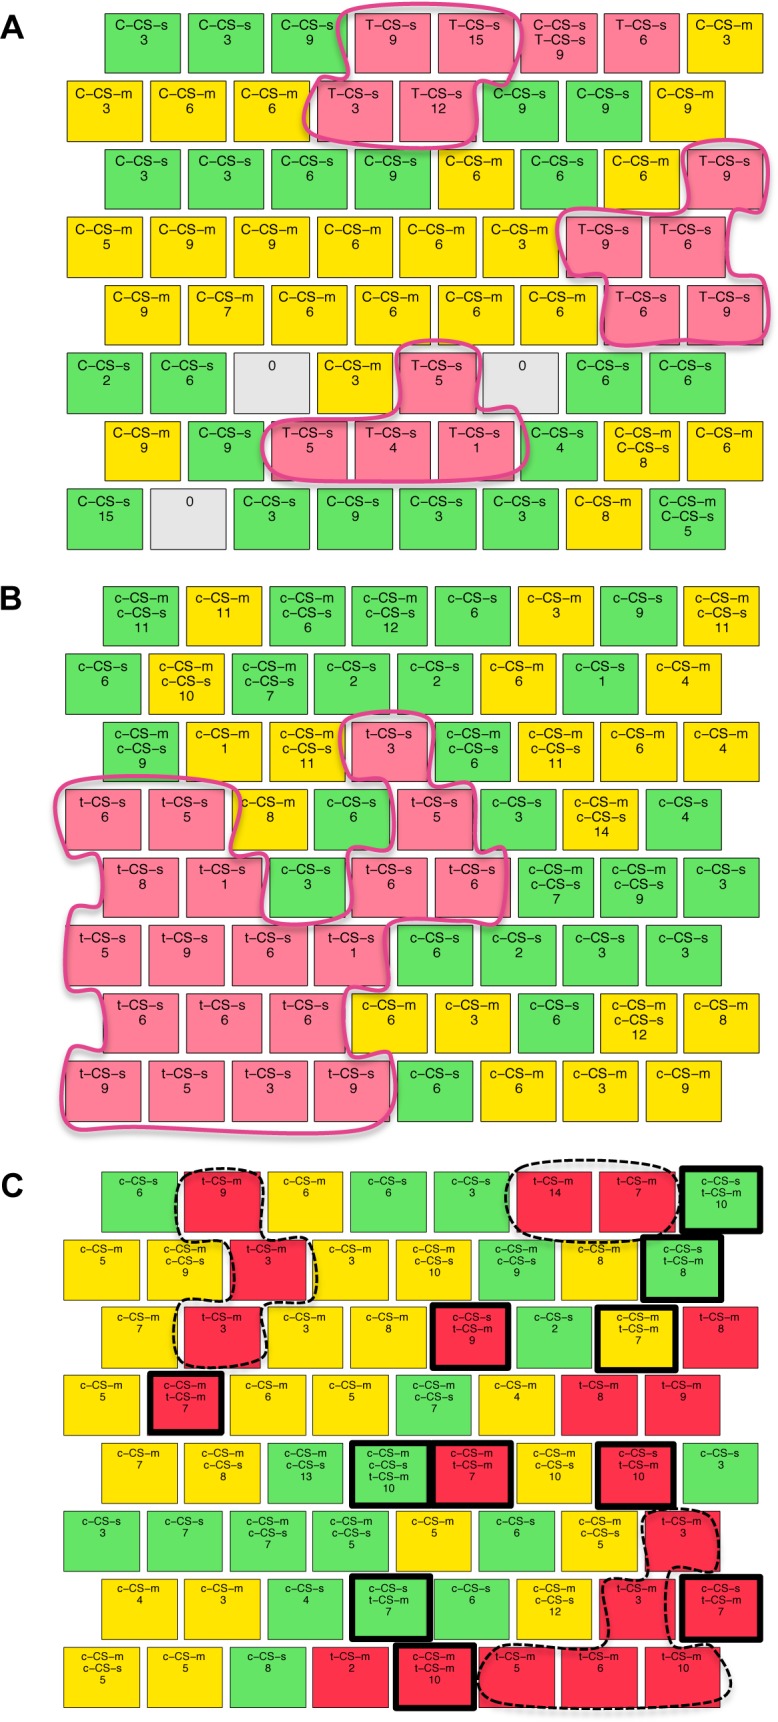
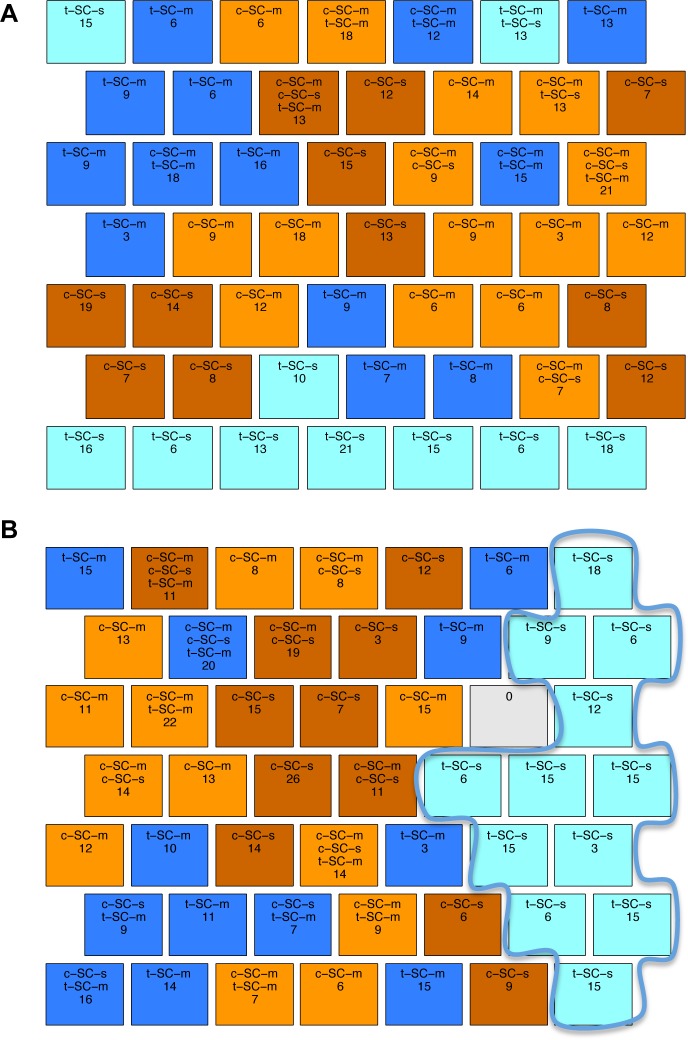
Down syndrome (DS) is a chromosomal abnormality (trisomy of human chromosome 21) associated with intellectual disability and affecting approximately one in 1000 live births worldwide. The overexpression of genes encoded by the extra copy of a normal chromosome in DS is believed to be sufficient to perturb normal pathways and normal responses to stimulation, causing learning and memory deficits. In this work, we have designed a strategy based on the unsupervised clustering method, Self Organizing Maps (SOM), to identify biologically important differences in protein levels in mice exposed to context fear conditioning (CFC). We analyzed expression levels of 77 proteins obtained from normal genotype control mice and from their trisomic littermates (Ts65Dn) both with and without treatment with the drug memantine. Control mice learn successfully while the trisomic mice fail, unless they are first treated with the drug, which rescues their learning ability. The SOM approach identified reduced subsets of proteins predicted to make the most critical contributions to normal learning, to failed learning and rescued learning, and provides a visual representation of the data that allows the user to extract patterns that may underlie novel biological responses to the different kinds of learning and the response to memantine. Results suggest that the application of SOM to new experimental data sets of complex protein profiles can be used to identify common critical protein responses, which in turn may aid in identifying potentially more effective drug targets.
Conflict of interest statement
Figures
Similar articles
-
Protein dynamics associated with failed and rescued learning in the Ts65Dn mouse model of Down syndrome.PLoS One. 2015 Mar 20;10(3):e0119491. doi: 10.1371/journal.pone.0119491. eCollection 2015. PLoS One. 2015. PMID: 25793384 Free PMC article.
-
The GABAAα5-selective Modulator, RO4938581, Rescues Protein Anomalies in the Ts65Dn Mouse Model of Down Syndrome.Neuroscience. 2018 Feb 21;372:192-212. doi: 10.1016/j.neuroscience.2017.12.038. Epub 2017 Dec 29. Neuroscience. 2018. PMID: 29292072
-
Acute injections of the NMDA receptor antagonist memantine rescue performance deficits of the Ts65Dn mouse model of Down syndrome on a fear conditioning test.Neuropsychopharmacology. 2008 Jun;33(7):1624-32. doi: 10.1038/sj.npp.1301535. Epub 2007 Aug 15. Neuropsychopharmacology. 2008. PMID: 17700645
-
On the promise of pharmacotherapies targeted at cognitive and neurodegenerative components of Down syndrome.Dev Neurosci. 2011;33(5):414-27. doi: 10.1159/000330861. Epub 2011 Sep 2. Dev Neurosci. 2011. PMID: 21893967 Free PMC article. Review.
-
On the cause of mental retardation in Down syndrome: extrapolation from full and segmental trisomy 16 mouse models.Brain Res Brain Res Rev. 2001 Apr;35(2):115-45. doi: 10.1016/s0926-6410(00)00074-4. Brain Res Brain Res Rev. 2001. PMID: 11336779 Review.
Cited by
-
Anomaly detection in mixed high-dimensional molecular data.Bioinformatics. 2023 Aug 1;39(8):btad501. doi: 10.1093/bioinformatics/btad501. Bioinformatics. 2023. PMID: 37584673 Free PMC article.
-
Identifying Cortical Molecular Biomarkers Potentially Associated with Learning in Mice Using Artificial Intelligence.Int J Mol Sci. 2025 Jul 17;26(14):6878. doi: 10.3390/ijms26146878. Int J Mol Sci. 2025. PMID: 40725125 Free PMC article.
-
In silico identification of critical proteins associated with learning process and immune system for Down syndrome.PLoS One. 2019 Jan 28;14(1):e0210954. doi: 10.1371/journal.pone.0210954. eCollection 2019. PLoS One. 2019. PMID: 30689644 Free PMC article.
-
Combining self-organizing maps and biplot analysis to preselect maize phenotypic components based on UAV high-throughput phenotyping platform.Plant Methods. 2019 May 28;15:57. doi: 10.1186/s13007-019-0444-6. eCollection 2019. Plant Methods. 2019. PMID: 31149023 Free PMC article.
-
Use of self-organizing maps for analyzing the behavior of canines displaced towards midline under interceptive treatment.Med Oral Patol Oral Cir Bucal. 2017 Mar 1;22(2):e233-e241. doi: 10.4317/medoral.21509. Med Oral Patol Oral Cir Bucal. 2017. PMID: 28160587 Free PMC article.
References
Publication types
MeSH terms
Substances
Grants and funding
LinkOut - more resources
Full Text Sources
Other Literature Sources
Medical
Molecular Biology Databases
