. 2015 Jun 25;11(6):e1004278.
doi: 10.1371/journal.pcbi.1004278. eCollection 2015 Jun.

The Decay of Motor Memories Is Independent of Context Change Detection

Affiliations

The Decay of Motor Memories Is Independent of Context Change Detection

Andrew E Brennan et al. PLoS Comput Biol. .

Abstract

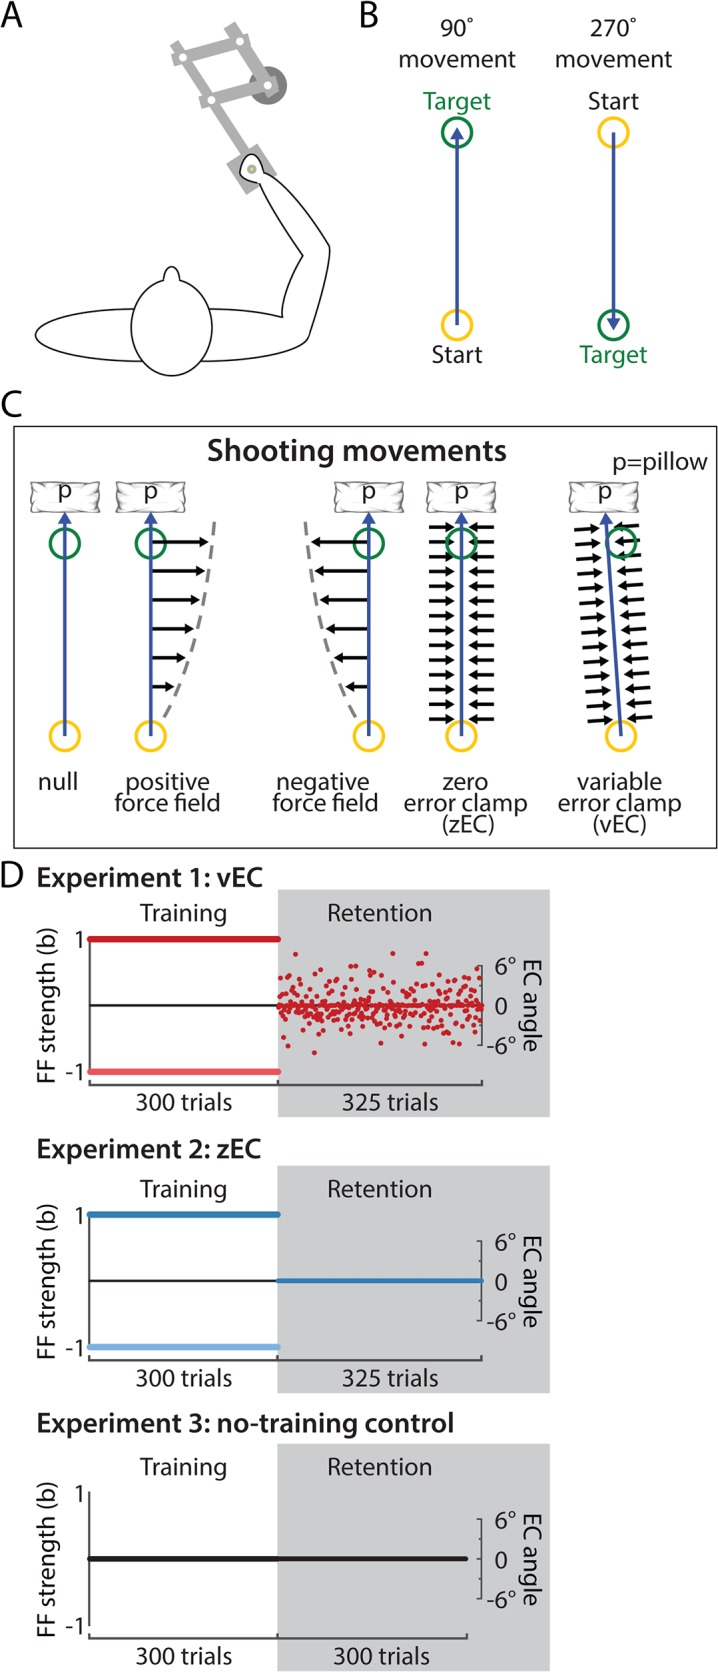
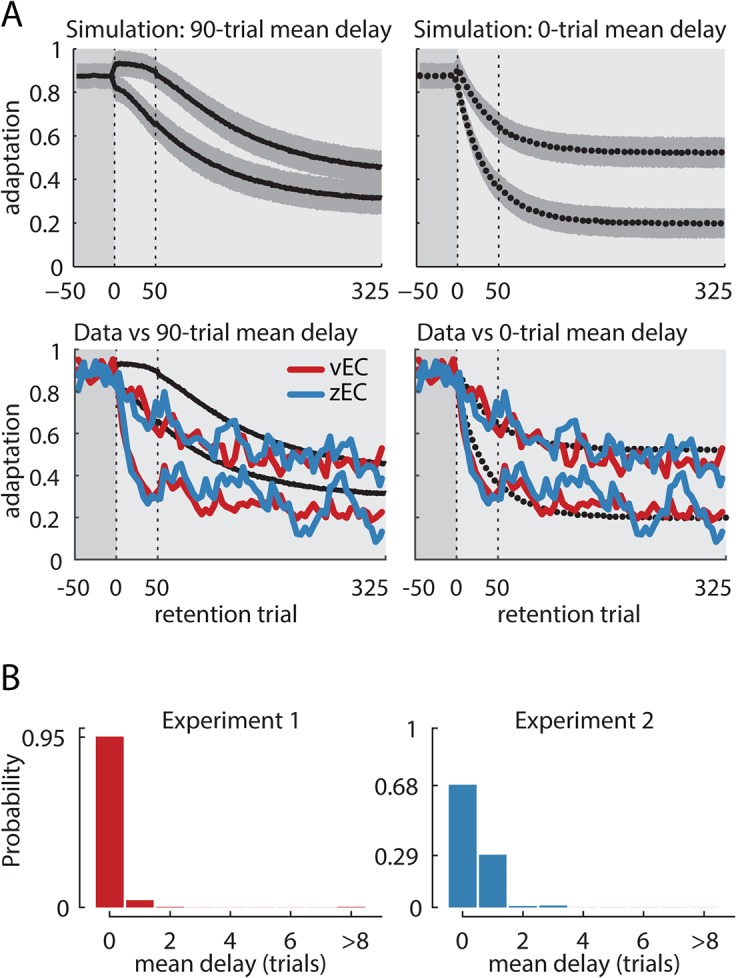
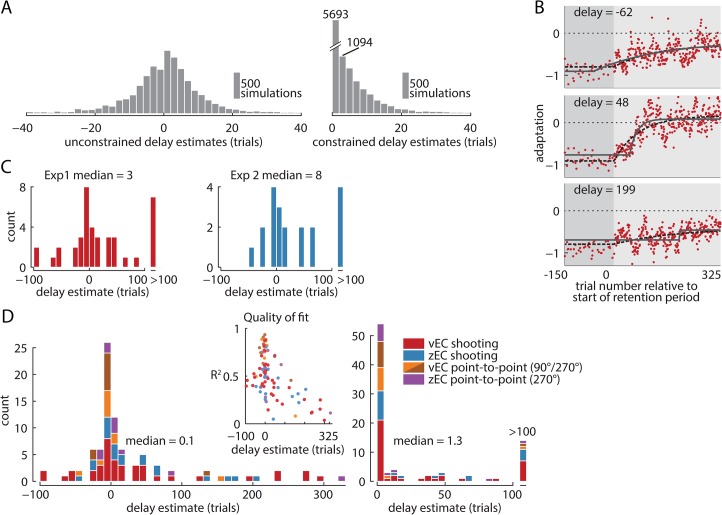
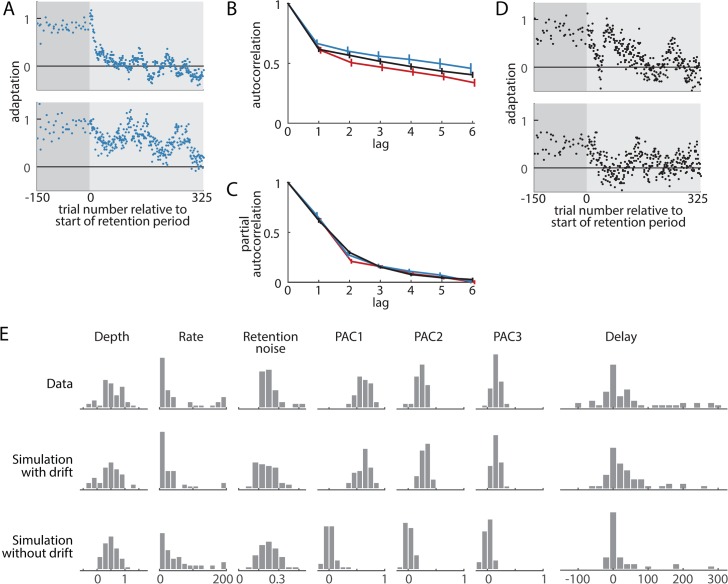
When the error signals that guide human motor learning are withheld following training, recently-learned motor memories systematically regress toward untrained performance. It has previously been hypothesized that this regression results from an intrinsic volatility in these memories, resulting in an inevitable decay in the absence of ongoing error signals. However, a recently-proposed alternative posits that even recently-acquired motor memories are intrinsically stable, decaying only if a change in context is detected. This new theory, the context-dependent decay hypothesis, makes two key predictions: (1) after error signals are withheld, decay onset should be systematically delayed until the context change is detected; and (2) manipulations that impair detection by masking context changes should result in prolonged delays in decay onset and reduced decay amplitude at any given time. Here we examine the decay of motor adaptation following the learning of novel environmental dynamics in order to carefully evaluate this hypothesis. To account for potential issues in previous work that supported the context-dependent decay hypothesis, we measured decay using a balanced and baseline-referenced experimental design that allowed for direct comparisons between analogous masked and unmasked context changes. Using both an unbiased variant of the previous decay onset analysis and a novel highly-powered group-level version of this analysis, we found no evidence for systematically delayed decay onset nor for the masked context change affecting decay amplitude or its onset time. We further show how previous estimates of decay onset latency can be substantially biased in the presence of noise, and even more so with correlated noise, explaining the discrepancy between the previous results and our findings. Our results suggest that the decay of motor memories is an intrinsic feature of error-based learning that does not depend on context change detection.


Conflict of interest statement

The authors have declared that no competing interests exist.

Figures

Fig 1
Fig 1. Experimental paradigm.
(A-B) Participants grasped the handle of a 2-link robotic manipulandum to make movements in one of two directions. All shooting movements were performed in the 90° direction. (C) Shooting movements were to be aimed at the target but “shot” through it and brought to rest by a virtual pillow (p) created by the robotic arm 1cm beyond the target center. Experiments had a training block consisting of positive force field (+FF) trials, negative FF (−FF) trials, or null trials (0-FF) in which the robotic manipulandum applied forces (black horizontal arrows) proportional to the movement velocity and directed orthogonally to the movement direction. This training block was followed by a retention block of error clamp trials, where forces were applied reactively with a virtual channel in order to effectively constrain motion to a predefined straight-line path. Zero-error clamp (zEC) retention trials were always directed toward the target’s center, resulting in very low directional variability. In contrast, variable error clamp (vEC) trials were directed along a different non-zero angle on each trial and were used to impose subtle directional variations (σ = 2.6°) from one trial to the next during the retention period. The amount of directional variability in the vEC trials was matched to the directional variability late in FF training, thereby reducing the context change from the training environment. Point-to-point movements were performed analogously but stopped at the target as illustrated in the supporting information (S1 File). (D) Each experiment began with a training period of FF trials. For experiments 1 and 2, there were two subgroups (dark and light colors), one training on +FF and the other training on—FF trials; both subgroups had the same retention periods. Experiment 1 had a vEC-based retention period, and had two variants: experiment 1a (n = 20, 10 on +FF and 10 on—FF) in which all subjects had the same pre-selected sequence of errors in the retention period; and experiment 1b (n = 20, 10 on +FF and 10 on—FF) in which all subjects had the mirror-opposite sequence of errors in the retention period. Experiments 2 and 3 had retention periods based on zEC trials. Note that the force field strength (b) was controlled during the training blocks while the error clamp angle was controlled during the retention blocks.
Fig 2
Fig 2. Comparison of movement characteristics during late training and early retention trials.
Lines connect the average values for the last 20 training trials (FF) and the first 20 retention trials (EC) for each subject in the shooting movement experiments for the 5 movement characteristics that Vaswani and Shadmehr ([14], V&S) used: Directional Variability (Endpoint Standard Deviation in V&S) is the standard deviation of movement angle; Probability of Reward is the observed reward frequency; Movement Duration is the time to the target; Intermovement Consistency measures the similarity of consecutive movements [15]; Trajectory Curvature (Trajectory Deviation in V&S) measures the curvature of the movement, and is the sum of squared lateral deviations from the straight path joining the start and end positions of that path. Subjects could use large differences in these characteristics between the training and retention blocks, as quantified by the ratio of the last 20 training trials to the first 20 retention trials (rightmost column), to detect context changes between these blocks. For all five statistics, the vEC retention blocks better match the statistics of the training environment than their zEC analogs, suggesting that the vEC context change should be harder to detect. The values and ratios we observe are very similar to those reported in V&S. Error bars show SEM.
Fig 3
Fig 3. Raw learning and decay.
(A) Left panel: motor adaptation and its decay during the training and retention periods in experiment 1a. There is clear adaptation, corresponding to the separation between the +FF and −FF groups (dark & light red) during training, and also clear decay, corresponding to the reduction of this separation during the retention period. However, there are large-amplitude oscillations in the retention period that obscure the underlying decay, especially if the +FF data are considered in isolation. Right panel: experiment 1b (mean shown in gray), which used the mirror-opposite vEC sequence, also shows large oscillations during the retention period but opposite in direction to the experiment 1a oscillations (mean shown in black). Combining the data from the two experiments (mean shown in red) balances the vEC sequence and largely eliminates the decay-obscuring oscillations, suggesting that they result from the specific vEC sequence employed. The vEC-balanced data reveal clear monotonic decay for both FF directions. (B) The learning and decay curves for the vEC-balanced experiment 1 data (red) and the zEC experiment 2 data (blue) closely match, suggesting little effect of context change salience on decay. In both cases, the +FF subgroups (darker colors) displayed highly attenuated learning and decay that was small but significant. In contrast, the −FF subgroups (lighter colors) displayed strong learning and robust decay. (C) Asymptotic learning was quantified using the average adaptation in the last 150 trials of the training block (100 trials for point-to-point zEC). Decay was quantified as the difference between asymptotic learning and the mean of all the retention trials after the first 150. These quantifications capture the asymmetries observed in the learning and decay curves (light versus dark bars), but more importantly show similar zEC and vEC learning (left panel) and decay (right panel), for both shooting and the point-to-point movements. For point-to-point movements, the hatched bars are experiment 4 (vECopp) in the 90° direction, which is opposite to the zEC movement direction. The red and blue solid bars represent experiments 4 and 5 (vEC and zEC) in the 270° direction. Error bars show SEM.
Fig 4
Fig 4. Learning and decay referenced to control data from a zero-FF training episode.
(A) Top row: raw lateral force profiles for the +FF and −FF subgroups (darker and lighter colors, respectively, with experiment 1 in red, experiment 2 in blue, mean ± SEM). The +FF and −FF subgroups display differently-shaped force profiles but similar overall force levels during training, corresponding to similar average endpoint errors (not shown). The −FF subgroup data are well-captured by the adaptation coefficient measure (black line), which is a regression onto the ideal force profile, while the +FF data are not. This explains why learning and decay appear attenuated in the +FF subgroup in Fig 3. We performed a control experiment consisting of a 0-FF “training” block and a zEC retention block (experiment 3) to provide a baseline reference for adaptation and decay. Considering the force profiles (colored traces in top row) relative to this baseline reference (gray traces in top row) reveals symmetric adaptation and decay between +FF and −FF conditions for both training and retention (colored traces in second row). Note that the control experiment force profiles increase substantially during the retention period, indicating that the unreferenced shooting movement decay data in Fig 3 are confounded by a tendency to produce more positive force during an extended EC block. Without control-referencing, this tendency causes the +FF decay to be underestimated and the −FF decay to be overestimated, as it was in Fig 3. Since the control-referenced retention data is still not always well explained by the shape of the adaptation coefficient measure, we quantified adaptation using an integrated lateral force measure that is agnostic to the shape of the force profile. (B) Like Fig 3, the control-referenced vEC and zEC learning and decay appear similar (red vs blue), but here we also see symmetric learning and decay across +FF and −FF conditions in both experiments. The strong decay apparent in both the +FF and −FF arms of the vEC experiment is in contrast to reports of the vEC manipulation eliminating decay. (C) Consistent with the unreferenced adaptation coefficients in Fig 3, the analysis based on control-referenced integrated lateral forces shows similar learning and decay for the analogous vEC and zEC experiments, but it displays much greater symmetry across +FF vs −FF conditions. For point-to-point movements, the vEC condition (red) actually seems to increase the decay somewhat over the corresponding zEC data (blue). These data fail to support the prediction that vEC-based retention will reduce or eliminate decay. For point-to-point movements, the hatched bars are experiment 4 (vECopp) in the 90° direction, which is opposite to the zEC movement direction. The red and blue solid bars represent experiments 4 and 5 (vEC and zEC) in the 270° direction. Error bars show SEM.
Fig 5
Fig 5. Group-level analysis of mean decay onset time.
(A) Top row: Simulated decay for scenarios with subjects having an exponential distribution of delays with means of 90 and 0 trials. For each scenario, we simulated 40 subjects and median divided them into two equal groups based on their decay during the first 50 trials of the retention period. The black curves show the mean decay obtained from 1000 such simulations with shading corresponding to the standard deviation across simulations. The low-decay subgroups for the simulations with a 90-trial mean delay show no early decay, quantified as the ratio between decay in the first 50 vs the last 75 retention trials, and it even has slightly elevated average adaptation in the first 50 trials due to a selection bias (see Results). In contrast, both subgroups from the simulations with a 0-trial mean delay decay immediately. Second row: The data from experiments 1–2 were median-divided in the same way, based on the amount of decay during the first 50 trials. The means of each of these subgroups are plotted in red and blue for vEC and zEC, respectively. For both experiments, the experimental data appear consistent with the simulations for zero-delay but not 90-trial mean delay (dotted vs solid lines). Note that the simulated curves are smooth because they represent the mean of 1000 simulations, where individual simulations vary much like the data do. (B) Estimates of the mean delay in our data using a Bayesian inference procedure based on the early decay ratios. We used simulations to estimate the joint distribution P(EDhigh, EDlow | μλ) for the mean delay μλ and the early decay ratios EDhigh and EDlow. This is a likelihood function for μλ. We then assumed a uniform prior over the integer mean delays from 0 to 90 trials to estimate the posterior distribution P(μλ | EDhigh, EDlow), which is proportional to P(EDhigh, EDlow | μλ) ∙ P(μλ) (see Methods). Large mean delays support the context detection hypothesis, which predicts decay to begin only after a change of context is detected. Near-zero delays are at odds with the context detection hypothesis because changes in variability cannot be detected immediately. The posterior distribution for experiments 1 (left) and 2 (right) are heavily skewed toward immediate decay, with a maximum a posteriori delay estimate of zero trials in both cases. The 95% confidence interval is 0 trials for experiment 1 and 0–1 trials for experiment 2, whose interval is somewhat more diffuse because it had 20 rather than 40 participants. These results are in stark contrast to the 90 and 40 trial mean delays reported for vEC and zEC shooting experiments in V&S, respectively.
Fig 6
Fig 6. Individual-level analysis of decay onset time.
(A) Distributions of delay parameter estimates obtained from fitting a delayed exponential to simulated noisy zero-delay data. Fits that did not constrain the delay parameter (left panel) resulted in a distribution of delay estimates centered near zero trials after the retention period onset with some positive and some negative delays. In contrast, constraining the fit delay to be non-negative (right panel) shifts the left half of the unconstrained distribution to zero while preserving the right half. Using the latter procedure, it impossible to meaningfully test for the existence of a delay since even the zero-delay simulation results in only positive values, substantially biasing the average delay estimate. (B) Three example subjects from experiment 1 with best-fit delayed exponentials (black lines). These subjects had best-fit delays that were moderately negative (top), moderately positive (middle), and highly positive (bottom). The dashed line represents the best-fit zero-delay exponential. (C) Delay parameter estimates for experiments 1 and 2 are centered near zero, with some positive and some negative estimated delays. The vEC condition (experiment 1) does not show more delay than the zEC condition (experiment 2), despite the masked context change that should make this change take longer to detect. (D) Histogram of delays aggregated across all experimental conditions based on unconstrained (left panel) and constrained (right panel) fits of the delay parameter. The right panel shows many positive delays but the potential negative delays that could balance these are not permitted by the fitting procedure so the significance of the positive delays cannot be discerned. In contrast, the left panel shows most delay estimates to be near zero, and is well-balanced between positive and negative values. The inset shows that the subjects who were well-fit by a delayed exponential tended to have delays near zero, while subjects who were poorly fit had delays more uniformly spaced throughout the fitting window [−100, 325], suggesting that the large amplitude delays likely arose from poor fitting rather than the existence of truly delayed decay behavior. These results are consistent with the group-level analysis.
Fig 7
Fig 7. The effect of drift in the retention period on the individual-level delay estimates.
We hypothesized that the poor fitting and large delays we found in some subjects in Fig 6D were due to random drifting noise in the retention period. (A) Two example subjects from the zEC shooting movement experiment show pronounced drift (large persistent deviations) in the retention period. (B-C) The autocorrelation function (B) at lag τ represents the raw correlation between trials separated by τ, i.e. between trial t and t−τ. The partial autocorrelation function (C) measures the correlations for trials separated by τ adjusting for the effects of the intermediate trials (see Methods). Independent noise will have autocorrelation and partial autocorrelation functions equal to zero. The red and blue traces from experiments 1 (vEC) and 2 (zEC) have autocorrelations consistently greater than zero, thus showing there is correlated noise (drift) present during the retention period data. The black lines are the result of a simulation designed to match the correlation structure of the data. The simulations included 60 subjects, each decaying with zero delay, and with individual differences in decay depth, decay rate, and noise level (see Methods). We then fit these simulations with delayed exponentials to determine the effect of the drift on the resulting distribution of delay estimates. (D) Two example simulated subjects show realistic drifting behavior, comparable to that in panel A. (E) Both the simulations with and without drift have similar histograms to the experimental data for decay depth, decay rate, and standard deviation of noise during the retention period (retention noise). As expected, the partial autocorrelation function at lags 1–3 (PAC1–PAC3) are different for the drift and no-drift simulations with the drift simulation matching the data. The simulation with drift results in delay estimates that have a distribution similar to the experimental data: largely centered at zero with a wide spread and several subjects with very large delay estimates. In contrast, the simulation without drift has a much narrower distribution of delays and fewer large delay estimates. This shows that the amount of drift present in the data is capable of causing best-fit delays to be very large even when the true delay is zero.

References

    1. Scheidt RA, Reinkensmeyer DJ, Conditt MA, Rymer WZ, Mussa-Ivaldi FA. Persistence of motor adaptation during constrained, multi-joint, arm movements. J Neurophysiol. 2000;84: 853–862. - PubMed
    1. Smith MA, Ghazizadeh A, Shadmehr R. Interacting adaptive processes with different timescales underlie short-term motor learning. PLoS Biol. 2006;4: e179 - PMC - PubMed
    1. Cheng S, Sabes PN. Calibration of visually-guided reaching is driven by error corrective learning and internal dynamics. J Neurophysiol. 2007;97: 3057–3069. - PMC - PubMed
    1. Criscimagna-Hemminger SE, Shadmehr R. Consolidation patterns of human motor memory. J Neurosci. 2008;28: 9610–9618. 10.1523/JNEUROSCI.3071-08.2008 - DOI - PMC - PubMed
    1. Sing GC, Joiner WM, Nanayakkara T, Brayanov JB, Smith MA. Primitives for motor adaptation reflect correlated neural tuning to position and velocity. Neuron. 2009;64: 575–589. 10.1016/j.neuron.2009.10.001 - DOI - PubMed

Publication types