. 2015 Aug;168(4):1476-89.
doi: 10.1104/pp.15.00450. Epub 2015 Jun 25.

Integrating Image-Based Phenomics and Association Analysis to Dissect the Genetic Architecture of Temporal Salinity Responses in Rice

Affiliations

Integrating Image-Based Phenomics and Association Analysis to Dissect the Genetic Architecture of Temporal Salinity Responses in Rice

Malachy T Campbell et al. Plant Physiol. 2015 Aug.

Abstract

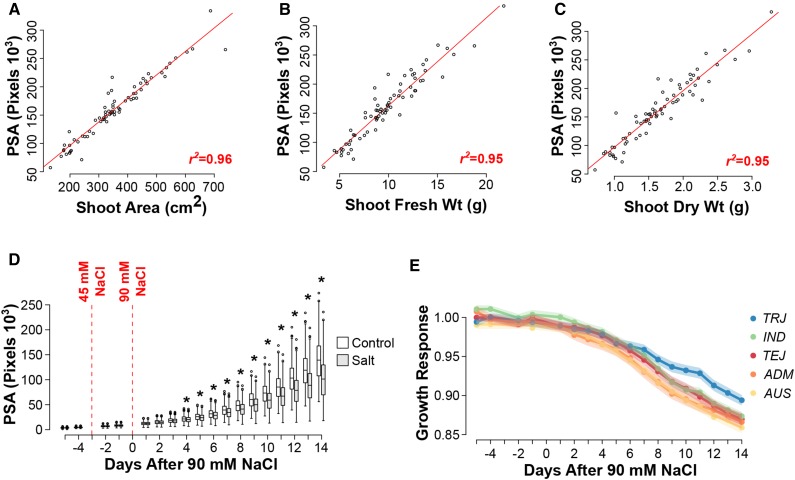
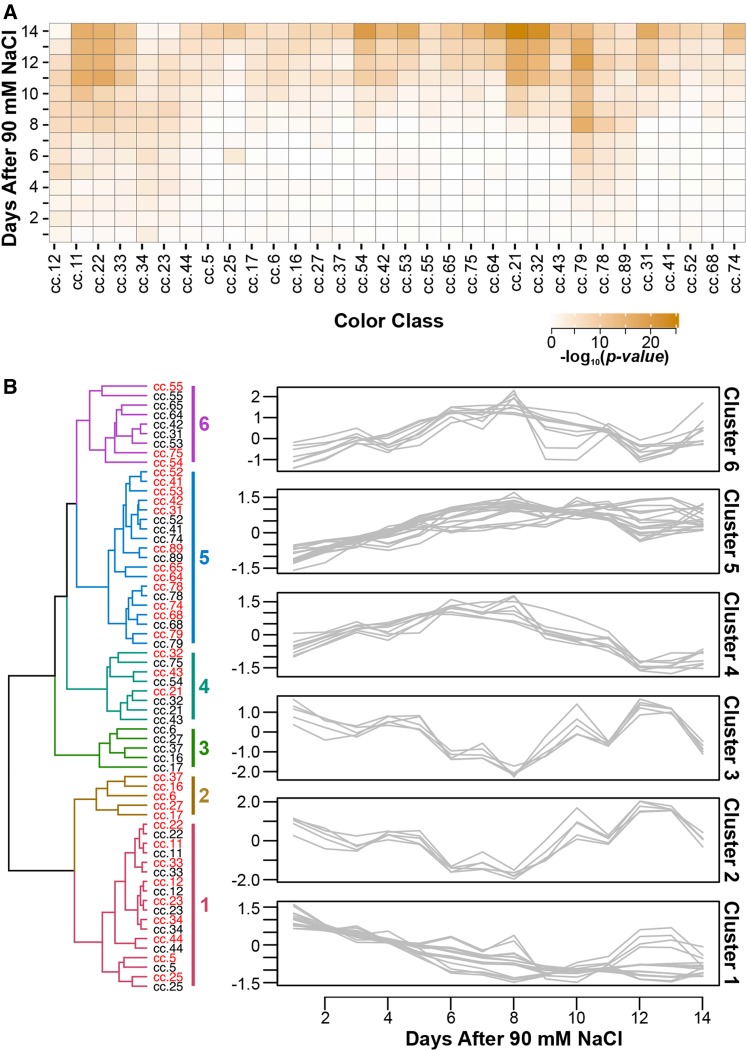
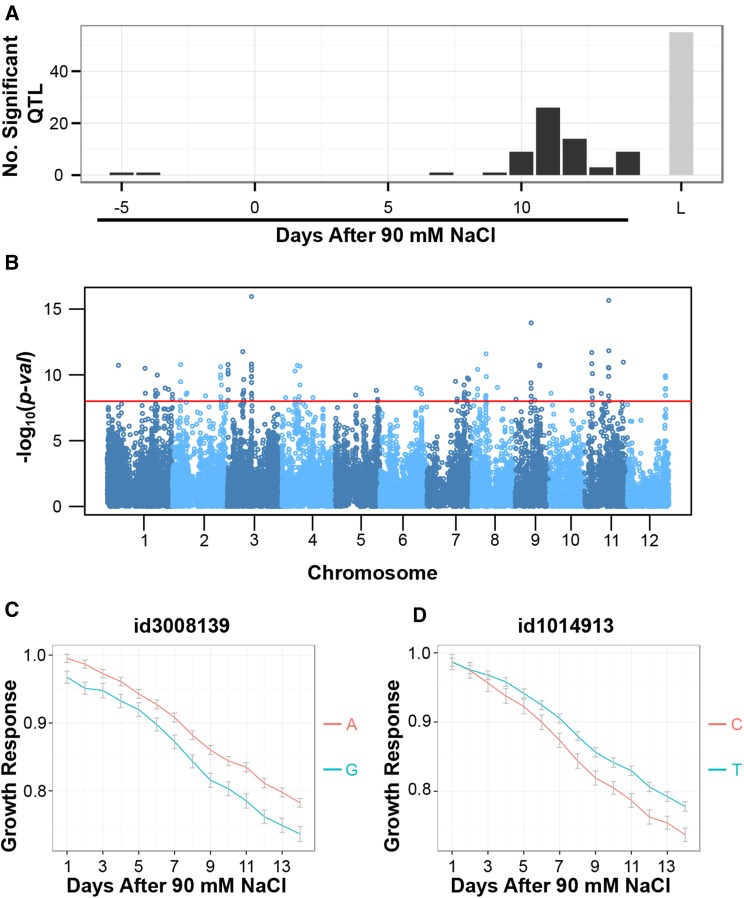
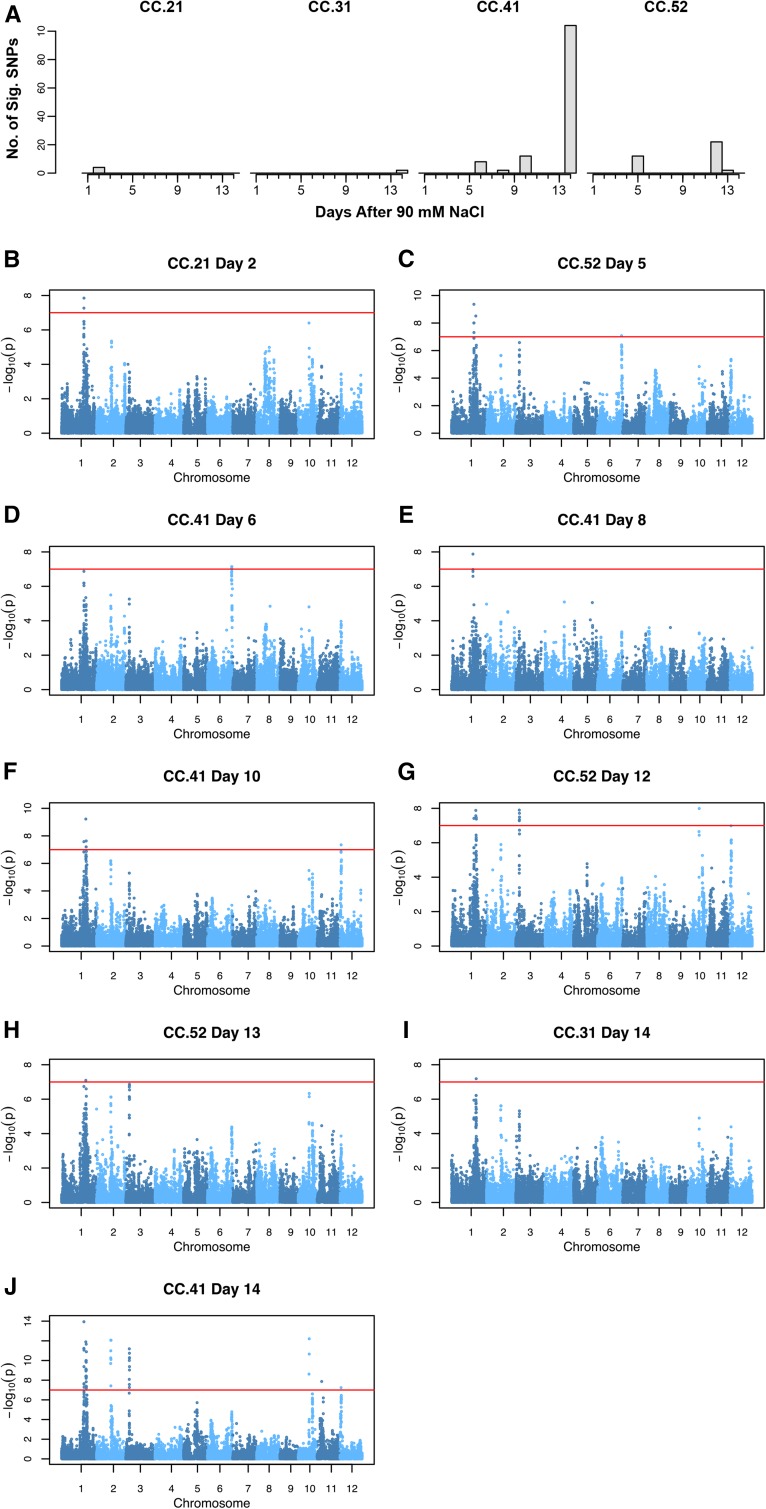
Salinity affects a significant portion of arable land and is particularly detrimental for irrigated agriculture, which provides one-third of the global food supply. Rice (Oryza sativa), the most important food crop, is salt sensitive. The genetic resources for salt tolerance in rice germplasm exist but are underutilized due to the difficulty in capturing the dynamic nature of physiological responses to salt stress. The genetic basis of these physiological responses is predicted to be polygenic. In an effort to address this challenge, we generated temporal imaging data from 378 diverse rice genotypes across 14 d of 90 mm NaCl stress and developed a statistical model to assess the genetic architecture of dynamic salinity-induced growth responses in rice germplasm. A genomic region on chromosome 3 was strongly associated with the early growth response and was captured using visible range imaging. Fluorescence imaging identified four genomic regions linked to salinity-induced fluorescence responses. A region on chromosome 1 regulates both the fluorescence shift indicative of the longer term ionic stress and the early growth rate decline during salinity stress. We present, to our knowledge, a new approach to capture the dynamic plant responses to its environment and elucidate the genetic basis of these responses using a longitudinal genome-wide association model.


Figures

Figure 1.
Figure 1.
Salinity-induced growth responses in a rice diversity panel. A to C, Relationship between PSA and conventional biomass metrics. Pearson correlation analyses were performed between PSA and shoot area (A), shoot fresh mass (B), and shoot dry mass (C). D, Comparisons of PSA between treatments at each of the 18 d of imaging. Differences between treatments at each time point were determined using a one-way blocked ANOVA, where accession is considered as a block (P < 0.0027). E, Comparison of salinity-induced growth response models between each of the five subpopulations defined by Zhao et al. (2011). The salinity-induced growth response was modeled with a decreasing logistic curve, and pairwise comparisons were made between each subpopulation. Aromatic accessions were excluded due to low n. Mean growth responses for each subpopulation are denoted by solid lines, while the se for each subpopulation is indicated by shadows. TRJ, Tropical japonica; TEJ, temperate japonica; IND, indica; ADM, admix.
Figure 2.
Figure 2.
The development of image-based fluorescence traits for monitoring chlorophyll responses to salinity. A, Salinity-responsive color classes were identified through comparisons between treatments at each time point via one-way ANOVA. Color classes were considered to be responsive to saline conditions if significant differences between treatments were observed in 3 or more days of 90 mm NaCl stress (P < 0.00056). B, Identification of color classes exhibiting similar trends over 14 d of 90 mm NaCl. HCA with complete linkage was performed using the mean value in each treatment for each color class. The six clusters are depicted to the right of the dendrogram. Labels in red indicate mean response in saline conditions, while those in black indicate control conditions. The right section summarizes the temporal trend captured by each cluster. The mean values for each color class were scaled and centered prior to clustering, so that the mean is 0 and variance is 1, and are represented on the y axis.
Figure 3.
Figure 3.
Examining the genetic architecture of salinity-induced growth responses using conventional mixed-model and logistic growth response association analysis. A, Comparison of conventional mixed-model association mapping approach with logistic growth response association mapping approach. A conventional association mapping approach was performed at each time point using the salinity-induced growth response as a phenotypic measure. With the mixed-model approach, an SNP was determined to be significant if P < 10–4, while a threshold of P < 10–8 was used for the logistic growth response model. Significant SNPs within a 200-kb window were combined and considered as a single QTL. L, Logistic growth response model. B, Manhattan plot for the logistic growth response association analysis. The red horizontal line indicates a significance threshold of P < 10–8. C, Comparison of growth response trajectories between allelic groups for the significant association observed at approximately 16.3 Mb on chromosome 3. A indicates the major allele (frequency, 0.68), and G indicates the minor allele (frequency, 0.32). D, Growth trajectories of major and minor allele accessions for the signal observed at approximately 25 Mb on chromosome 1. T indicates the major allele (frequency, 0.79), and C indicates the minor allele (frequency, 0.21).
Figure 4.
Figure 4.
Examining the genetic architecture of salinity-induced fluorescence responses. A, Summary of the significant signals detected for color classes 21, 31, 41, and 52 at each time point after 90 mm NaCl. The x axis indicates the number of days after 90 mm NaCl application, while the y axis shows the number of SNPs with P < 10–7 that were detected with the conventional mixed-model GWA approach. B to J, Genome-wide P values for each fluorescent color class exhibiting significant genetic associations. The red horizontal line indicates a significance threshold of P < 10–7. The corresponding color class and day after 90 mm NaCl is given in the title above each plot.

References

    1. Apse MP, Aharon GS, Snedden WA, Blumwald E (1999) Salt tolerance conferred by overexpression of a vacuolar Na+/H+ antiport in Arabidopsis. Science 285: 1256–1258 - PubMed
    1. Asano T, Hayashi N, Kobayashi M, Aoki N, Miyao A, Mitsuhara I, Ichikawa H, Komatsu S, Hirochika H, Kikuchi S, et al. (2012) A rice calcium-dependent protein kinase OsCPK12 oppositely modulates salt-stress tolerance and blast disease resistance. Plant J 69: 26–36 - PubMed
    1. Azaizeh H, Steudle E (1991) Effects of salinity on water transport of excised maize (Zea mays L.) roots. Plant Physiol 97: 1136–1145 - PMC - PubMed
    1. Bac-Molenaar JA, Vreugdenhil D, Granier C, Keurentjes JJB (April 28, 2015) Genome-wide association mapping of growth dynamics detects time-specific and general quantitative trait loci. J Exp Bot http://dx.doi.org/10.1093/jxb/erv176 - DOI - PMC - PubMed
    1. Berger B, Parent B, Tester M (2010) High-throughput shoot imaging to study drought responses. J Exp Bot 61: 3519–3528 - PubMed

Publication types

MeSH terms

LinkOut - more resources