

Presenilin-1 familial Alzheimer's disease mutation alters hippocampal neurogenesis and memory function in CCL2 null mice
- PMID: 26112421
- PMCID: PMC4567522
- DOI: 10.1016/j.bbi.2015.06.014
Presenilin-1 familial Alzheimer's disease mutation alters hippocampal neurogenesis and memory function in CCL2 null mice
Abstract
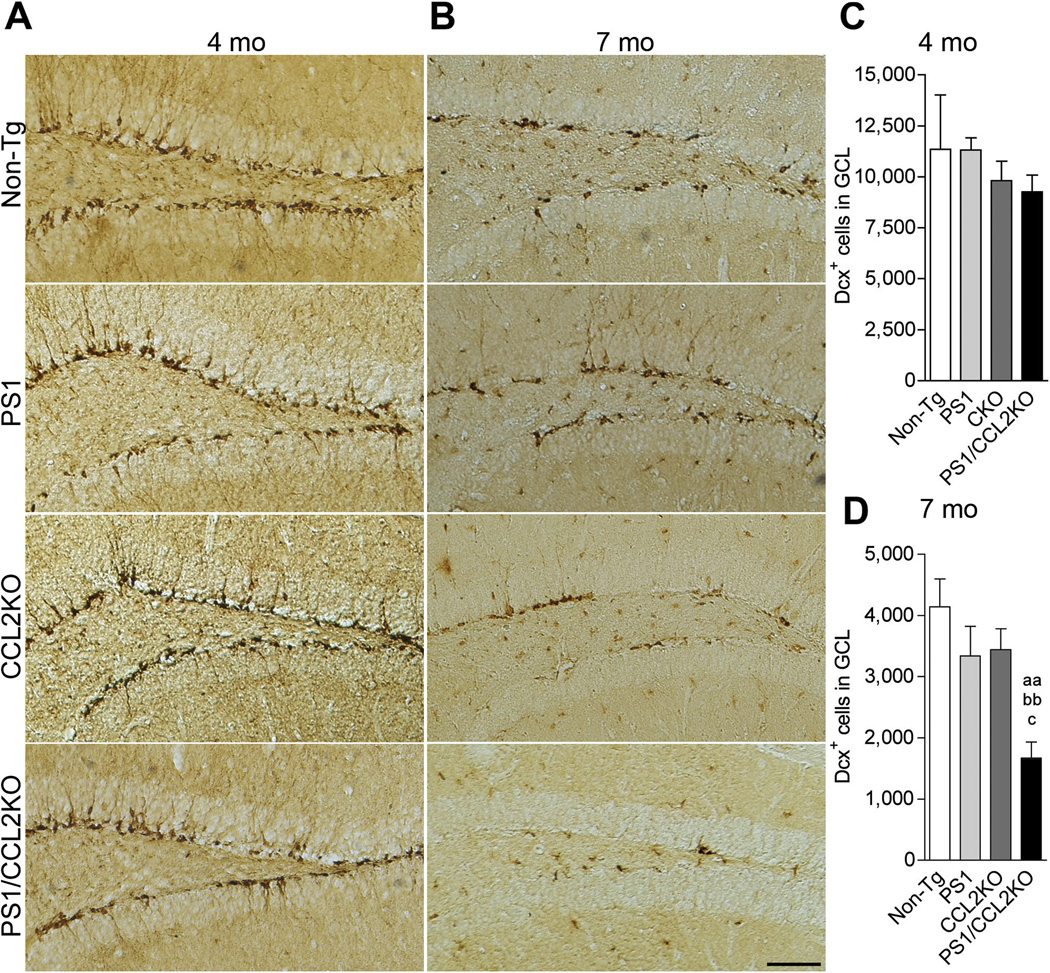
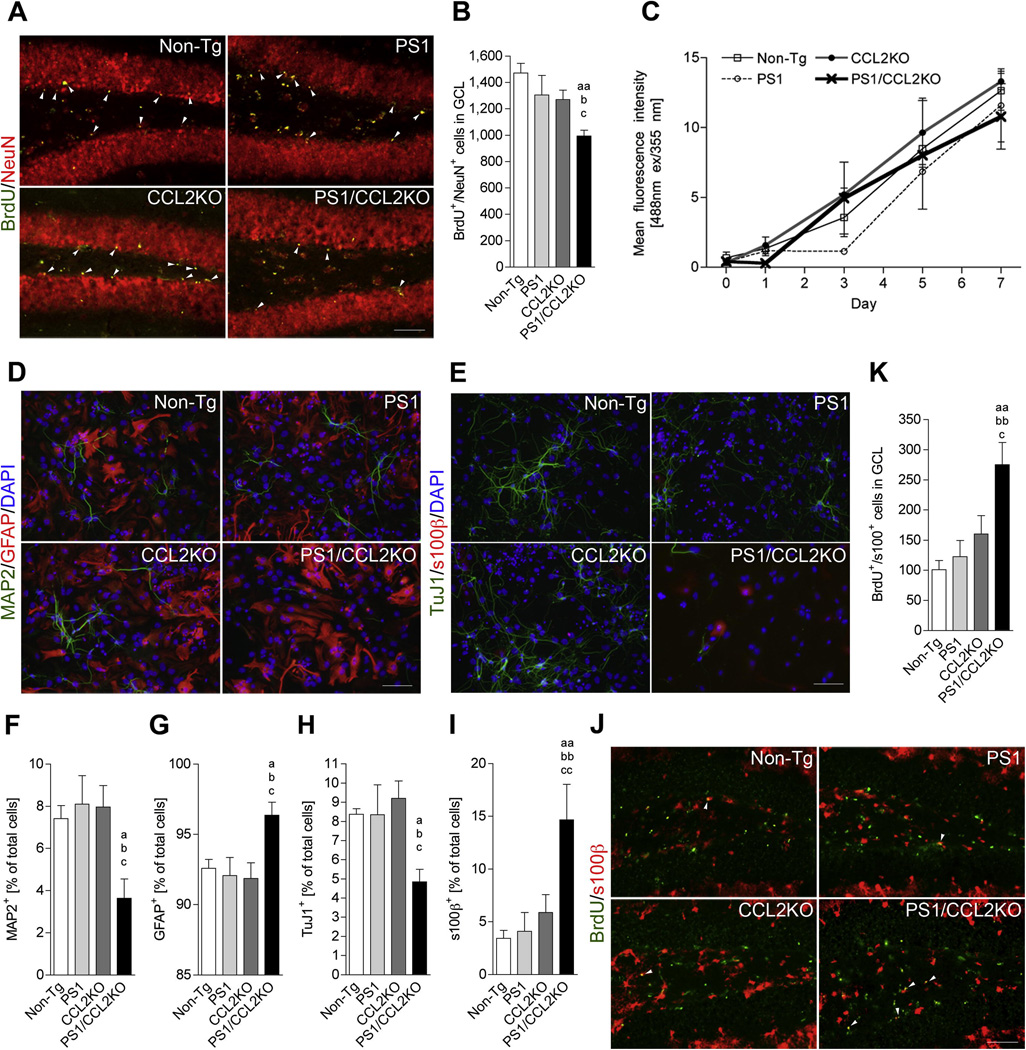
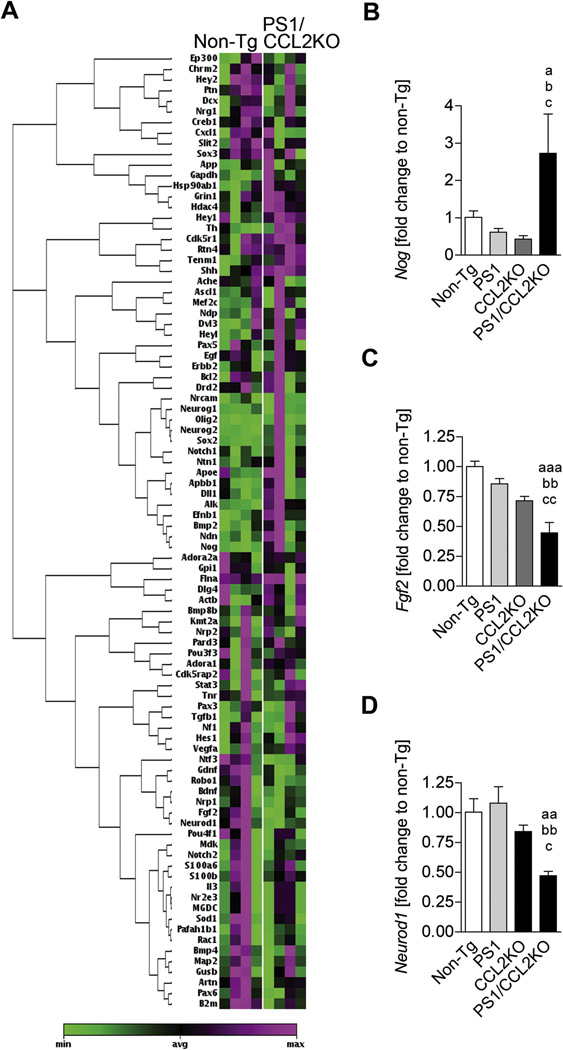
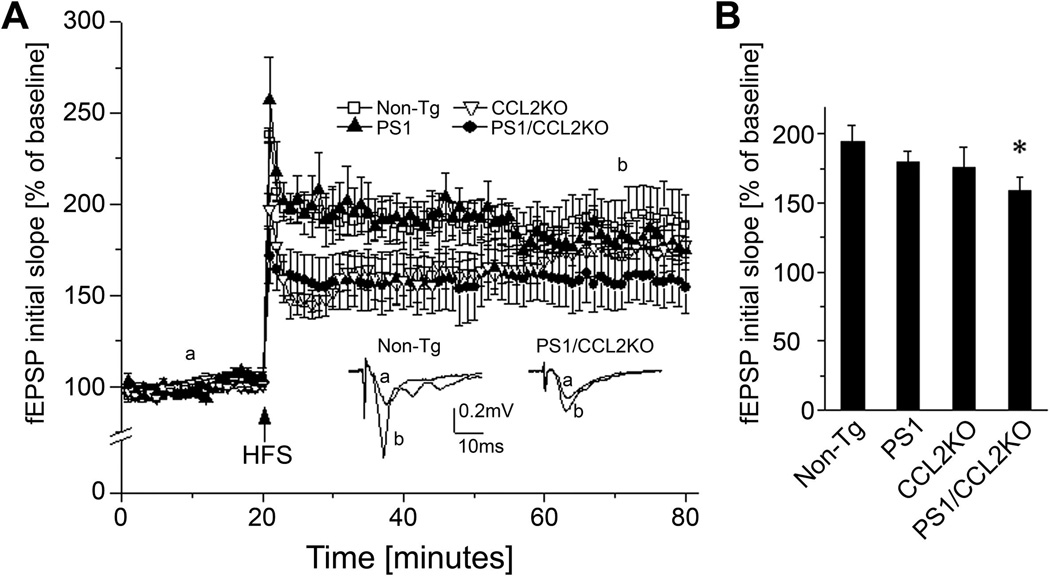
Aberrations in hippocampal neurogenesis are associated with learning and memory, synaptic plasticity and neurodegeneration in Alzheimer's disease (AD). However, the linkage between them, β-amyloidosis and neuroinflammation is not well understood. To this end, we generated a mouse overexpressing familial AD (FAD) mutant human presenilin-1 (PS1) crossed with a knockout (KO) of the CC-chemokine ligand 2 (CCL2) gene. The PS1/CCL2KO mice developed robust age-dependent deficits in hippocampal neurogenesis associated with impairments in learning and memory, synaptic plasticity and long-term potentiation. Neurogliogenesis gene profiling supported β-amyloid independent pathways for FAD-associated deficits in hippocampal neurogenesis. We conclude that these PS1/CCL2KO mice are suitable for studies linking host genetics, immunity and hippocampal function.
Keywords: Chemokine; Hippocampus; Long-term potentiation; Morris water maze; Neurogliogenesis.
Copyright © 2015 The Authors. Published by Elsevier Inc. All rights reserved.
Conflict of interest statement
The authors declare no competing financial interest.
Figures


Similar articles
-
Hippocampal spatial memory impairments caused by the familial Alzheimer's disease-linked presenilin 1 M146V mutation.Neurodegener Dis. 2005;2(1):6-15. doi: 10.1159/000086426. Neurodegener Dis. 2005. PMID: 16908998
-
FGF2 gene transfer restores hippocampal functions in mouse models of Alzheimer's disease and has therapeutic implications for neurocognitive disorders.Proc Natl Acad Sci U S A. 2011 Dec 6;108(49):E1339-48. doi: 10.1073/pnas.1102349108. Epub 2011 Oct 31. Proc Natl Acad Sci U S A. 2011. PMID: 22042871 Free PMC article.
-
Deficits in Enrichment-Dependent Neurogenesis and Enhanced Anxiety Behaviors Mediated by Expression of Alzheimer's Disease-Linked Ps1 Variants Are Rescued by Microglial Depletion.J Neurosci. 2019 Aug 21;39(34):6766-6780. doi: 10.1523/JNEUROSCI.0884-19.2019. Epub 2019 Jun 19. J Neurosci. 2019. PMID: 31217332 Free PMC article.
-
Presenilin transgenic mice as models of Alzheimer's disease.Brain Struct Funct. 2010 Mar;214(2-3):127-43. doi: 10.1007/s00429-009-0227-3. Epub 2009 Nov 18. Brain Struct Funct. 2010. PMID: 19921519 Free PMC article. Review.
-
The Impact of Estradiol on Neurogenesis and Cognitive Functions in Alzheimer's Disease.Cell Mol Neurobiol. 2020 Apr;40(3):283-299. doi: 10.1007/s10571-019-00733-0. Epub 2019 Sep 9. Cell Mol Neurobiol. 2020. PMID: 31502112 Free PMC article. Review.
Cited by
-
URMC-099 facilitates amyloid-β clearance in a murine model of Alzheimer's disease.J Neuroinflammation. 2018 May 5;15(1):137. doi: 10.1186/s12974-018-1172-y. J Neuroinflammation. 2018. PMID: 29729668 Free PMC article.
-
Anti-retroviral drugs: current state and development in the next decade.Acta Pharm Sin B. 2018 Mar;8(2):131-136. doi: 10.1016/j.apsb.2018.01.012. Epub 2018 Mar 7. Acta Pharm Sin B. 2018. PMID: 29719774 Free PMC article. Review.
-
Magnesium-L-threonate Ameliorates Cognitive Deficit by Attenuating Adult Hippocampal Neurogenesis Impairment in a Mouse Model of Alzheimer's Disease.Exp Neurobiol. 2025 Apr 30;34(2):53-62. doi: 10.5607/en24030. Epub 2025 Apr 16. Exp Neurobiol. 2025. PMID: 40234095 Free PMC article.
-
Cathepsin B Improves ß-Amyloidosis and Learning and Memory in Models of Alzheimer's Disease.J Neuroimmune Pharmacol. 2017 Jun;12(2):340-352. doi: 10.1007/s11481-016-9721-6. Epub 2016 Dec 13. J Neuroimmune Pharmacol. 2017. PMID: 27966067 Free PMC article.
-
Reboxetine Treatment Reduces Neuroinflammation and Neurodegeneration in the 5xFAD Mouse Model of Alzheimer's Disease: Role of CCL2.Mol Neurobiol. 2019 Dec;56(12):8628-8642. doi: 10.1007/s12035-019-01695-6. Epub 2019 Jul 11. Mol Neurobiol. 2019. PMID: 31297718
References
-
- Aimone JB, Wiles J, Gage FH. Potential role for adult neurogenesis in the encoding of time in new memories. Nat Neurosci. 2006;9:723–727. - PubMed
-
- Arendash GW, Schleif W, Rezai-Zadeh K, Jackson EK, Zacharia LC, Cracchiolo JR, Shippy D, Tan J. Caffeine protects Alzheimer's mice against cognitive impairment and reduces brain beta-amyloid production. Neuroscience. 2006;142:941–952. - PubMed
Publication types
MeSH terms
Substances
Grants and funding
- R01 NS036126/NS/NINDS NIH HHS/United States
- P01 NS043985/NS/NINDS NIH HHS/United States
- NS043985/NS/NINDS NIH HHS/United States
- P01 DA028555/DA/NIDA NIH HHS/United States
- P30 MH062261/MH/NIMH NIH HHS/United States
- AG043540/AG/NIA NIH HHS/United States
- NS036126/NS/NINDS NIH HHS/United States
- MH062261/MH/NIMH NIH HHS/United States
- R01 NS077873/NS/NINDS NIH HHS/United States
- R01 NS034239/NS/NINDS NIH HHS/United States
- DA028555/DA/NIDA NIH HHS/United States
- MH064570/MH/NIMH NIH HHS/United States
- P01 MH064570/MH/NIMH NIH HHS/United States
- NS034239/NS/NINDS NIH HHS/United States
- R37 NS036126/NS/NINDS NIH HHS/United States
- R01 AG043540/AG/NIA NIH HHS/United States
LinkOut - more resources
Full Text Sources
Other Literature Sources
Medical
Molecular Biology Databases
Research Materials
