Diffuse, non-polar electropermeabilization and reduced propidium uptake distinguish the effect of nanosecond electric pulses
- PMID: 26112464
- PMCID: PMC4554928
- DOI: 10.1016/j.bbamem.2015.06.018
Diffuse, non-polar electropermeabilization and reduced propidium uptake distinguish the effect of nanosecond electric pulses
Abstract
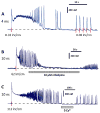
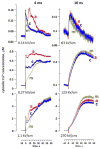
Ca2+ activation and membrane electroporation by 10-ns and 4-ms electric pulses (nsEP and msEP) were compared in rat embryonic cardiomyocytes. The lowest electric field which triggered Ca2+ transients was expectedly higher for nsEP (36 kV/cm) than for msEP (0.09 kV/cm) but the respective doses were similar (190 and 460 mJ/g). At higher intensities, both stimuli triggered prolonged firing in quiescent cells. An increase of basal Ca2+ level by >10 nM in cells with blocked voltage-gated Ca2+ channels and depleted Ca2+ depot occurred at 63 kV/cm (nsEP) or 0.14 kV/cm (msEP) and was regarded as electroporation threshold. These electric field values were at 150-230% of stimulation thresholds for both msEP and nsEP, notwithstanding a 400,000-fold difference in pulse duration. For comparable levels of electroporative Ca2+ uptake, msEP caused at least 10-fold greater uptake of propidium than nsEP, suggesting increased yield of larger pores. Electroporation by msEP started Ca2+ entry abruptly and locally at the electrode-facing poles of cell, followed by a slow diffusion to the center. In a stark contrast, nsEP evoked a "supra-electroporation" pattern of slower but spatially uniform Ca2+ entry. Thus nsEP and msEP had comparable dose efficiency, but differed profoundly in the size and localization of electropores.
Keywords: Calcium activation; Cardiomyocytes; Electropermeabilization; Electroporation; Nanosecond electric pulses.
Copyright © 2015 Elsevier B.V. All rights reserved.
Figures


Similar articles
-
The interplay of excitation and electroporation in nanosecond pulse stimulation.Bioelectrochemistry. 2020 Dec;136:107598. doi: 10.1016/j.bioelechem.2020.107598. Epub 2020 Jul 15. Bioelectrochemistry. 2020. PMID: 32711366 Free PMC article. Review.
-
The second phase of bipolar, nanosecond-range electric pulses determines the electroporation efficiency.Bioelectrochemistry. 2018 Aug;122:123-133. doi: 10.1016/j.bioelechem.2018.03.014. Epub 2018 Mar 29. Bioelectrochemistry. 2018. PMID: 29627664 Free PMC article.
-
Multiple nanosecond electric pulses increase the number but not the size of long-lived nanopores in the cell membrane.Biochim Biophys Acta. 2015 Apr;1848(4):958-66. doi: 10.1016/j.bbamem.2014.12.026. Epub 2015 Jan 10. Biochim Biophys Acta. 2015. PMID: 25585279 Free PMC article.
-
Sub-MHz bursts of nanosecond pulses excite neurons at paradoxically low electric field thresholds without membrane damage.Biochim Biophys Acta Biomembr. 2022 Nov 1;1864(11):184034. doi: 10.1016/j.bbamem.2022.184034. Epub 2022 Aug 15. Biochim Biophys Acta Biomembr. 2022. PMID: 35981654
-
Nanosecond electric pulses: a mini-review of the present state of the art.Bioelectrochemistry. 2015 Jun;103:2-6. doi: 10.1016/j.bioelechem.2014.07.008. Epub 2014 Aug 12. Bioelectrochemistry. 2015. PMID: 25190180 Review.
Cited by
-
Genetically engineered HEK cells as a valuable tool for studying electroporation in excitable cells.Sci Rep. 2024 Jan 6;14(1):720. doi: 10.1038/s41598-023-51073-5. Sci Rep. 2024. PMID: 38184741 Free PMC article.
-
The interplay of excitation and electroporation in nanosecond pulse stimulation.Bioelectrochemistry. 2020 Dec;136:107598. doi: 10.1016/j.bioelechem.2020.107598. Epub 2020 Jul 15. Bioelectrochemistry. 2020. PMID: 32711366 Free PMC article. Review.
-
Nanosecond pulsed electric fields increase antibiotic susceptibility in methicillin-resistant Staphylococcus aureus.Microbiol Spectr. 2024 Jan 11;12(1):e0299223. doi: 10.1128/spectrum.02992-23. Epub 2023 Dec 4. Microbiol Spectr. 2024. PMID: 38092563 Free PMC article.
-
Nanosecond pulsed electric fields modulate the expression of the astaxanthin biosynthesis genes psy, crtR-b and bkt 1 in Haematococcus pluvialis.Sci Rep. 2020 Sep 23;10(1):15508. doi: 10.1038/s41598-020-72479-5. Sci Rep. 2020. PMID: 32968095 Free PMC article.
-
Probing Nanoelectroporation and Resealing of the Cell Membrane by the Entry of Ca2+ and Ba2+ Ions.Int J Mol Sci. 2020 May 11;21(9):3386. doi: 10.3390/ijms21093386. Int J Mol Sci. 2020. PMID: 32403282 Free PMC article.
References
-
- Morotomi-Yano K, Akiyama H, Yano K. Nanosecond pulsed electric fields activate MAPK pathways in human cells. Archives of Biochemistry and Biophysics. 2011;515:99–106. - PubMed
Publication types
MeSH terms
Substances
Grants and funding
LinkOut - more resources
Full Text Sources
Other Literature Sources
Miscellaneous

