. 2015 Jun 26:12:126.
doi: 10.1186/s12974-015-0349-x.

Tumor necrosis factor-α enhances voltage-gated Na⁺ currents in primary culture of mouse cortical neurons

Affiliations

Tumor necrosis factor-α enhances voltage-gated Na⁺ currents in primary culture of mouse cortical neurons

Weiqiang Chen et al. J Neuroinflammation. .

Abstract

Background: Previous studies showed that TNF-α could activate voltage-gated Na(+) channels (VGSCs) in the peripheral nervous system (PNS). Since TNF-α is implicated in many central nervous system (CNS) diseases, we examined potential effects of TNF-α on VGSCs in the CNS.

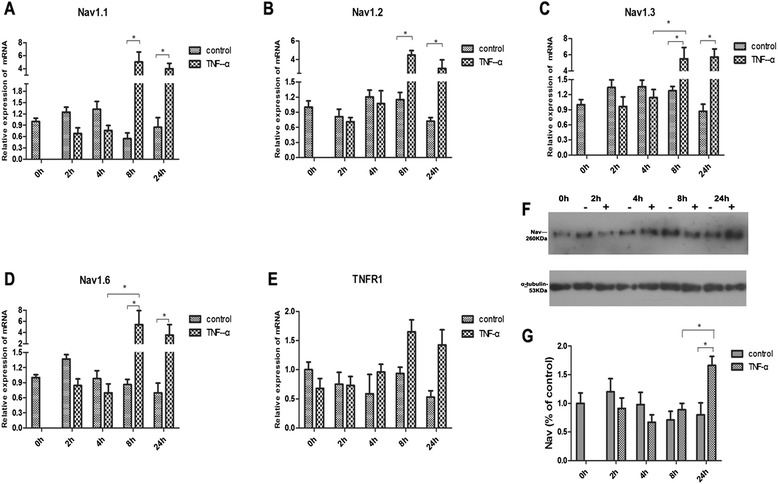
Methods: Effects of TNF-α (1-1000 pg/mL, for 4-48 h) on VGSC currents were examined using whole-cell voltage clamp and current clamp techniques in primary culture of mouse cortical neurons. Expression of Nav1.1, Nav1.2, Nav1.3, and Nav1.6 were examined at both the mRNA and protein levels, prior to and after TNF-α exposure.

Results: TNF-α increased Na(+) currents by accelerating the activation of VGSCs. The threshold for action potential (AP) was decreased and firing rate were increased. VGSCs were up-regulated at both the mRNA and protein levels. The observed effects of TNF-α on Na(+) currents were inhibited by pre-incubation with the NF-κB inhibitor BAY 11-7082 (1 μM) or the p38 mitogen-activated protein kinases (MAPK) inhibitor SB203580 (1 μM).

Conclusions: TNF-α increases Na(+) currents by accelerating the channel activation as well as increasing the expression of VGSCs in a mechanism dependent upon NF-κB and p38 MAPK signal pathways in CNS neurons.


Figures

Fig. 1
Fig. 1
Concentration-dependent effects of tumor necrosis factor-α (TNF-α) on voltage-gated Na+ currents in cultured mouse cortical neurons. a Expression of TNF-α receptor 1 in mouse cortical neurons as detected by RT-PCR. b Original recording curves of whole-cell currents from −80 to 100 mV in control and TTX (300 nM) treated neurons. c Typical recording curves of whole-cell Na+ currents from −80 to 100 mV in the control and TNF-α-treated (100 pg/ml, 24 h) neurons. d Current density–voltage relationship in the control and TNF-α-treated (10 and 100 pg/ml, 24 h) groups. e Concentration-dependent effects of TNF-α (1, 10, 100, and 1000 pg/ml) on Na+ currents. Data were normalized against the control and expressed as percentage of the control group. *P < 0.05 vs. the control (one-way ANOVA followed by SNK test)
Fig. 2
Fig. 2
Time-dependent effects of TNF-α on Na+ currents and electrophysiological characteristics of Na+ currents. a Current density–voltage relationship in the group treated with 100 and 1000 pg/ml TNF-α and control group for 24 h. b Time dependency of TNF-α (100 and 1000 pg/ml) effects on Na+ currents ranging from 0 to 48 h. Current data were normalized by the control and expressed as percentage of the control group. *P < 0.05 as compared with 0 h group, # P < 0.05 the 100 or 1000 pg/ml TNF-α-treated group (24 h) vs. the control group (24 h), and 1000 pg/ml TNF-α-treated group (24 h) vs. the control group (48 h) (two-way ANOVA). c Voltage-dependent activation curves (Boltzmann equation and fitting parameters) in the 100 pg/ml TNF-α-treated (24 h) and 24 h control groups. d Voltage-dependent fast-inactivation curves (Boltzmann equation and fitting parameters) in the 100 pg/ml TNF-α-treated (24 h) and 24 h control groups
Fig. 3
Fig. 3
Effects of TNF-α on the expression of TNFR1 mRNA and VGSCs. Normative expression level of Nav1.1 (a), Nav1.2 (b), Nav1.3 (c), Nav1.6 (d), and TNF-R1 (e) mRNA. The value of each group was obtained from three separate experiments done in duplicates. *P < 0.05 vs. the relevant control (two-way ANOVA). f Nav channels protein expression in cortical neurons were detected with western blot “−”: treated with 0.1 % BSA in PBS buffer, “+”: treated with TNF-α (100 pg/ml) in PBS buffer. g The value of each group was obtained from three separate experiments. *P < 0.05 (two-way ANOVA)
Fig. 4
Fig. 4
Inhibition of NF-κB and p38 MAPK decreased the TNF-α augmentation of Na+ currents. a Typical recording curves of whole-cell Na+ currents from −80 to 100 mV in the control and TNF-α (100 ng/ml, 24 h), TNF-α + BAY 11-7082(1 uM), and TNF-α + SB203580 (1 uM)groups. b Normalized peak current–voltage relationship in the control and TNF-α (100 pg/ml, 24 h), TNF-α + BAY 11-7082(1 uM), and TNF-α + SB203580 (1 uM) groups. *P < 0.05 vs. the 24 h control group; # P < 0.05 vs. TNF-α (100 pg/ml, 24 h) group (one-way ANOVA followed by SNK). c Voltage-dependent activation curves (Boltzmann equation and fitting parameters) in the TNF-α (100 pg/ml, 24 h), TNF-α + BAY 11-7082, and TNF-α + SB203580 groups. d Voltage-dependent inactivation curves (Boltzmann equation and fitting parameters) in the TNF-α (100 pg/ml, 24 h), TNF-α + BAY 11-7082, and TNF-α + SB203580 groups
Fig. 5
Fig. 5
Effects of TNF-α on spike. a, b Traces showing representative recordings of action potentials. Threshold of action potential was significantly lower in the TNF-α group than in the control group. c Histogram showing the action potential threshold in the control and TNF-α groups, (*P < 0.05, n = 10 in each group (Student’s t-test). d and e Representative recordings of firing rate of action potential in response to current injection (500 pA, 1 s) in the control and TNF-α (100 pg/ml for 24 h) groups. f Histogram showing the firing rate in the control and TNF-α (100 pg/ml for 24 h) groups. *P < 0.05, Student’s t-test (n = 8 in each group)

Similar articles

Cited by

References

    1. Montgomery SL, Bowers WJ. Tumor necrosis factor-alpha and the roles it plays in homeostatic and degenerative processes within the central nervous system. J Neuroimmune Pharmacol. 2012;7:42–59. doi: 10.1007/s11481-011-9287-2. - DOI - PubMed
    1. Lee TH, Huang Q, Oikemus S, Shank J, Ventura JJ, Cusson N, et al. The death domain kinase RIP1 is essential for tumor necrosis factor alpha signaling to p38 mitogen-activated protein kinase. Mol Cell Biol. 2003;23:8377–85. doi: 10.1128/MCB.23.22.8377-8385.2003. - DOI - PMC - PubMed
    1. Fontaine V, Mohand-Said S, Hanoteau N, Fuchs C, Pfizenmaier K, Eisel U. Neurodegenerative and neuroprotective effects of tumor necrosis factor (TNF) in retinal ischemia: opposite roles of TNF receptor 1 and TNF receptor 2. J Neurosci. 2002;22:RC216. - PMC - PubMed
    1. Liu BG, Dobretsov M, Stimers JR, Zhang JM. Tumor necrosis factor-α suppresses activation of sustained potassium currents in rat small diameter sensory neurons. Open Pain J. 2008;1:1. doi: 10.2174/1876386300902010001. - DOI - PMC - PubMed
    1. Motagally MA, Lukewich MK, Chisholm SP, Neshat S, Lomax AE. Tumour necrosis factor alpha activates nuclear factor kappaB signalling to reduce N-type voltage-gated Ca2+ current in postganglionic sympathetic neurons. J Physiol. 2009;587:2623–34. doi: 10.1113/jphysiol.2009.172312. - DOI - PMC - PubMed

Publication types

MeSH terms

LinkOut - more resources