

Hyperglycemia and liver ischemia reperfusion injury: a role for the advanced glycation endproduct and its receptor pathway
- PMID: 26112980
- PMCID: PMC9438741
- DOI: 10.1111/ajt.13360
Hyperglycemia and liver ischemia reperfusion injury: a role for the advanced glycation endproduct and its receptor pathway
Abstract
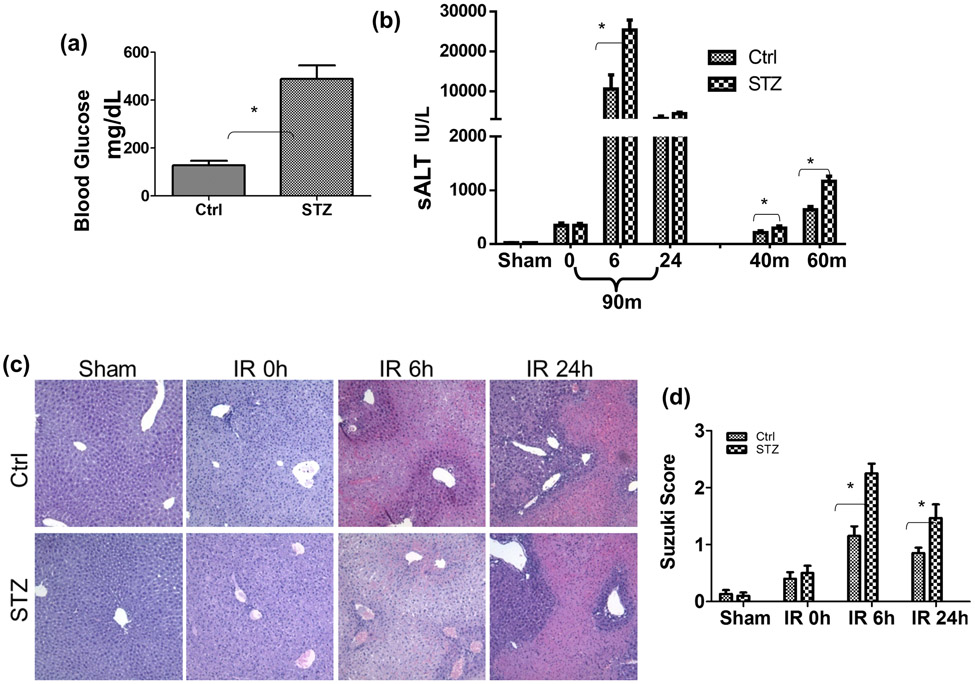
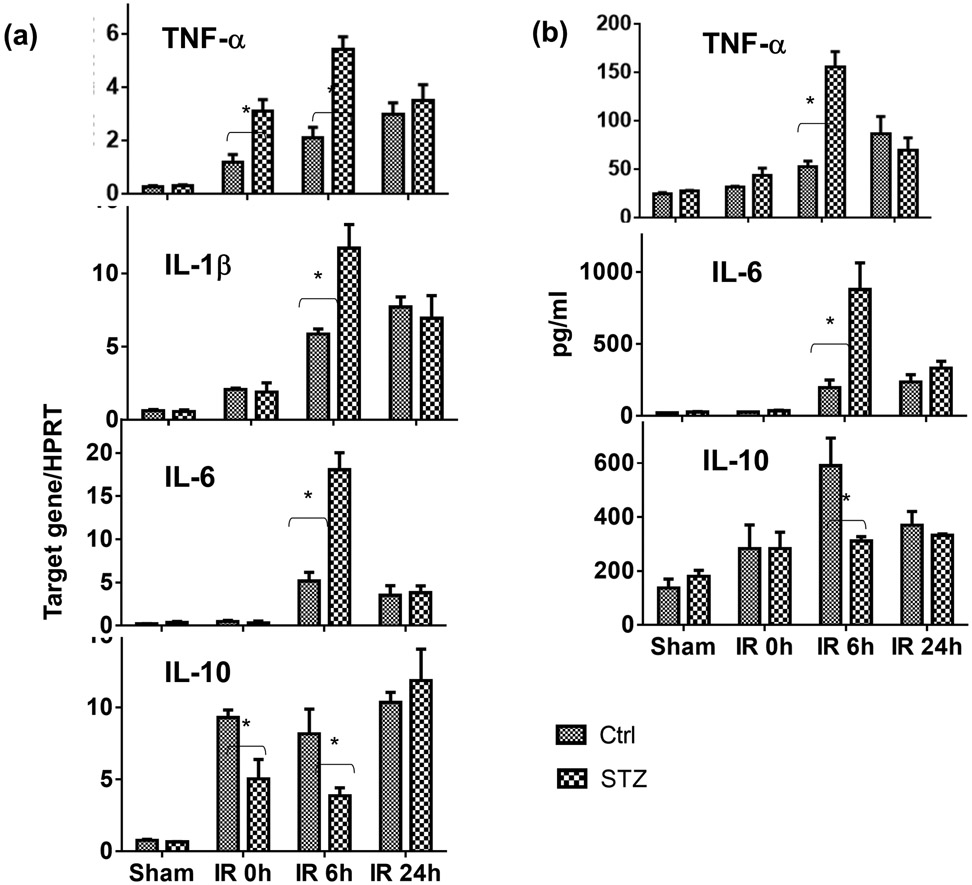
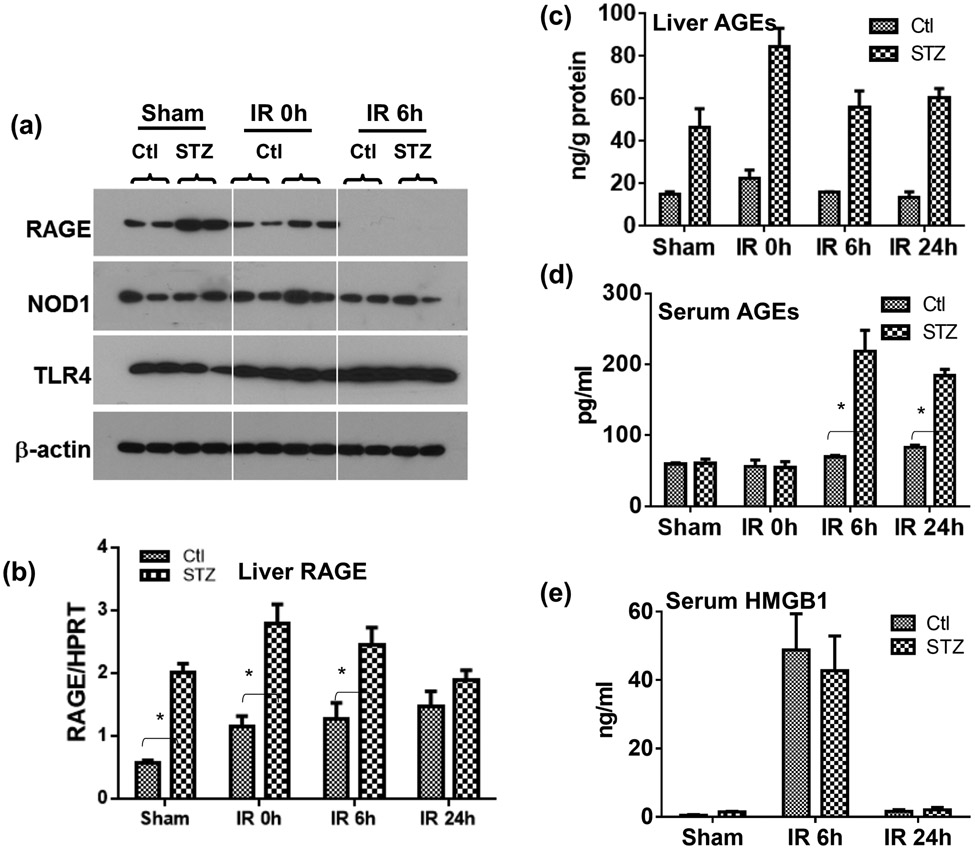
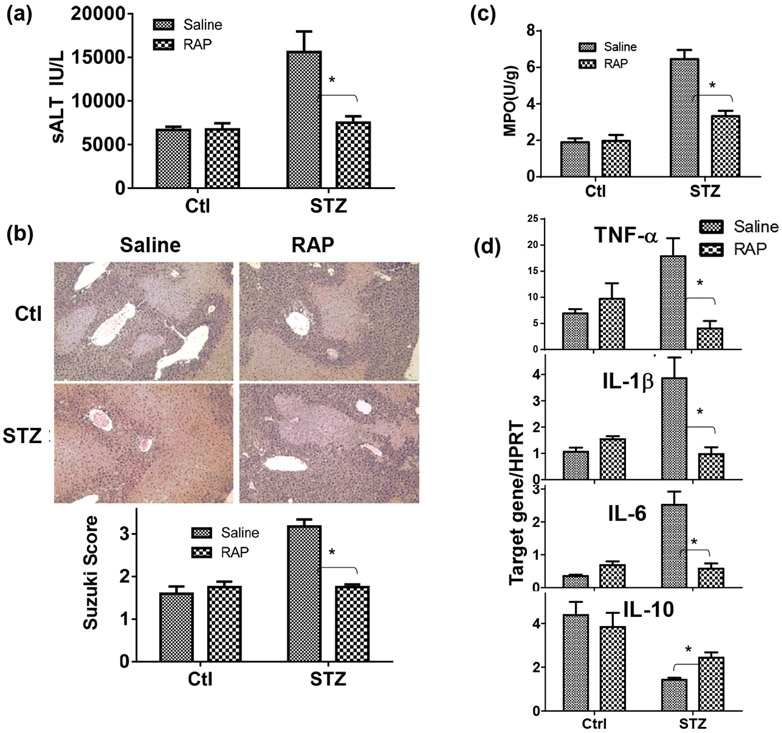
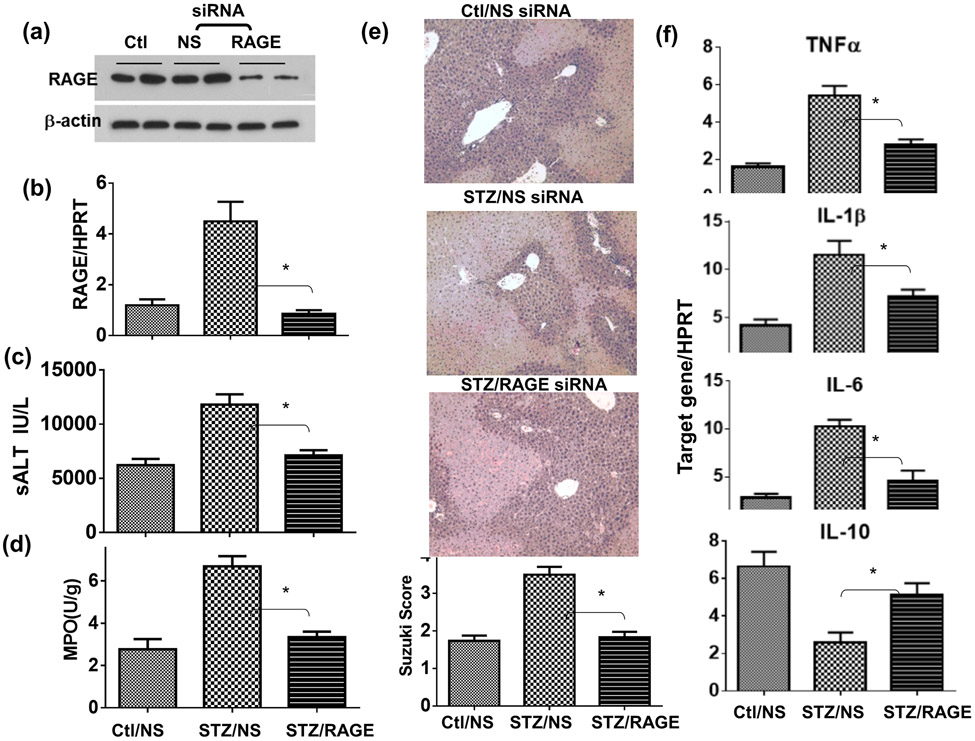
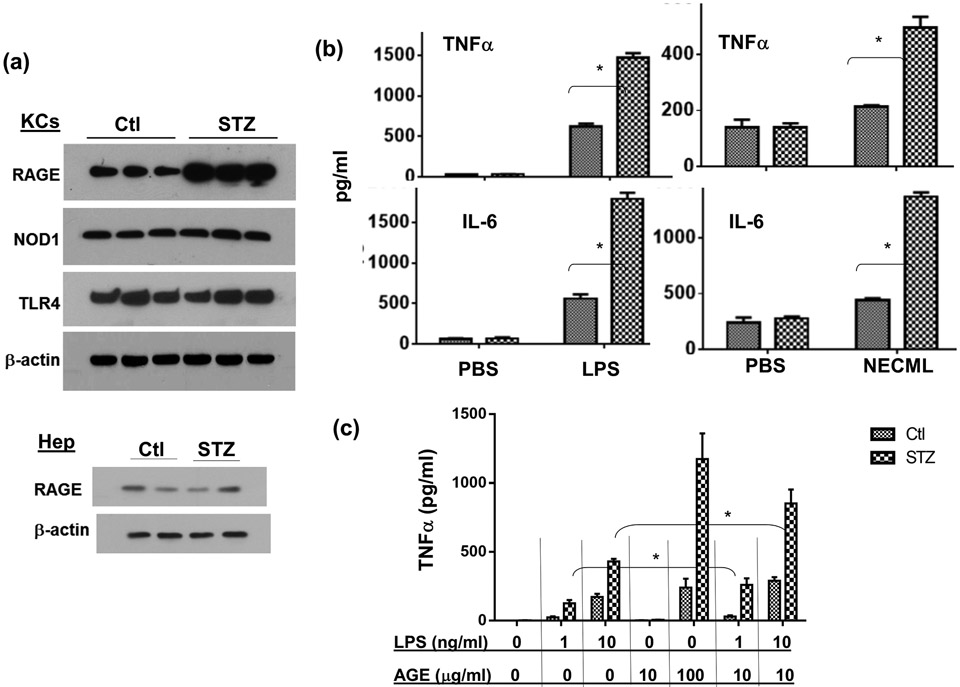
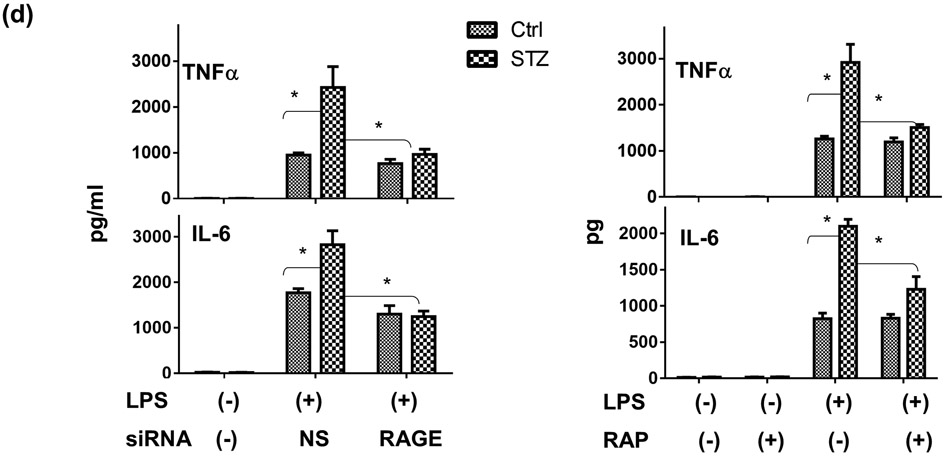
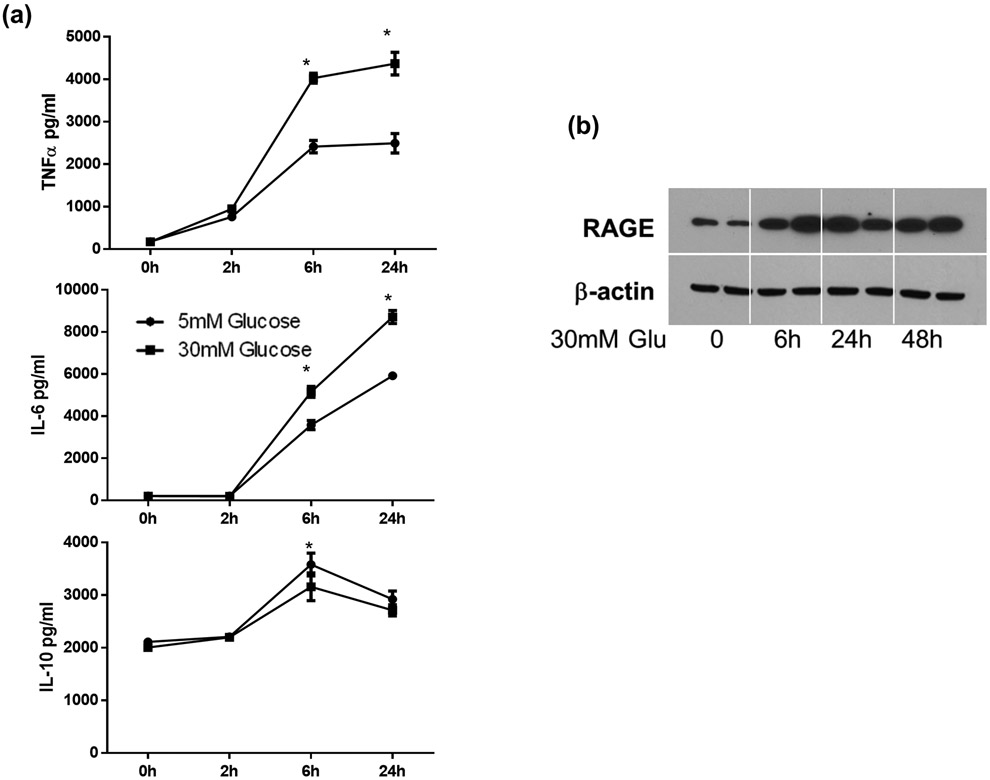
Although pretransplant diabetes is a risk factor for mortality post-liver transplant, the underlying mechanism has not been fully defined. In a murine liver partial warm ischemia model, we addressed the question of how diabetes/hyperglycemia impacted tissue inflammatory injuries against ischemia reperfusion (IR), focusing on the advanced glycation endproduct (AGE) and its receptor (RAGE) pathway. Our results showed that hepatocellular injury was exacerbated in streptozotocin-induced diabetic mice against IR, in association with hyper-inflammatory immune activation in livers. Serum levels of AGEs, but not HMGB1, were increased in diabetic mice in response to liver IR. Both RAGE antagonist peptides and small interfering RNA alleviated liver injuries and inhibited inflammatory immune activation against IR in diabetic, but not normal, mice. Kupffer cells (KCs)/macrophages, but not hepatocytes, from diabetic mice expressed significantly higher levels of RAGE, leading to their hyper-inflammatory responsiveness to both TLR ligands and AGEs. In vitro, hyperglycemia increased macrophage RAGE expression and enhanced their TLR responses. Our results demonstrated that activation of the AGE-RAGE signaling pathway in KCs was responsible for hyper-inflammatory immune responses and exacerbated hepatocellular injuries in diabetic/hyperglycemic hosts against liver IR.
Keywords: cytokines/cytokine receptors; diabetes; immune/inflammatory; ischemia reperfusion injury (IRI); liver disease; macrophage/monocyte biology: activation.
© Copyright 2015 The American Society of Transplantation and the American Society of Transplant Surgeons.
Conflict of interest statement
Disclosure: The authors of this manuscript have no conflicts of interest to disclose as described by the American Journal of Transplantation.
Figures
Similar articles
-
Hyperglycemia Aggravates Hepatic Ischemia and Reperfusion Injury by Inhibiting Liver-Resident Macrophage M2 Polarization via C/EBP Homologous Protein-Mediated Endoplasmic Reticulum Stress.Front Immunol. 2017 Oct 13;8:1299. doi: 10.3389/fimmu.2017.01299. eCollection 2017. Front Immunol. 2017. PMID: 29081777 Free PMC article.
-
ATF6 mediates a pro-inflammatory synergy between ER stress and TLR activation in the pathogenesis of liver ischemia-reperfusion injury.Am J Transplant. 2014 Jul;14(7):1552-61. doi: 10.1111/ajt.12711. Epub 2014 Jun 5. Am J Transplant. 2014. PMID: 24903305 Free PMC article.
-
Acute hyperglycemic exacerbation of lung ischemia-reperfusion injury is mediated by receptor for advanced glycation end-products signaling.Am J Respir Cell Mol Biol. 2012 Mar;46(3):299-305. doi: 10.1165/rcmb.2011-0247OC. Epub 2011 Oct 6. Am J Respir Cell Mol Biol. 2012. PMID: 21980055 Free PMC article.
-
Hyperglycemia-Triggered Sphingosine-1-Phosphate and Sphingosine-1-Phosphate Receptor 3 Signaling Worsens Liver Ischemia/Reperfusion Injury by Regulating M1/M2 Polarization.Liver Transpl. 2019 Jul;25(7):1074-1090. doi: 10.1002/lt.25470. Epub 2019 Jun 3. Liver Transpl. 2019. PMID: 30972941 Free PMC article.
-
ATF3-mediated NRF2/HO-1 signaling regulates TLR4 innate immune responses in mouse liver ischemia/reperfusion injury.Am J Transplant. 2015 Jan;15(1):76-87. doi: 10.1111/ajt.12954. Epub 2014 Oct 30. Am J Transplant. 2015. PMID: 25359217
Cited by
-
Hyperglycemia Aggravates Hepatic Ischemia and Reperfusion Injury by Inhibiting Liver-Resident Macrophage M2 Polarization via C/EBP Homologous Protein-Mediated Endoplasmic Reticulum Stress.Front Immunol. 2017 Oct 13;8:1299. doi: 10.3389/fimmu.2017.01299. eCollection 2017. Front Immunol. 2017. PMID: 29081777 Free PMC article.
-
The Role of Gut Microbiota and Circadian Rhythm Oscillation of Hepatic Ischemia-Reperfusion Injury in Diabetic Mice.Biomedicines. 2023 Dec 25;12(1):54. doi: 10.3390/biomedicines12010054. Biomedicines. 2023. PMID: 38255161 Free PMC article.
-
The Receptor for Advanced Glycation Endproducts (RAGE) Contributes to Severe Inflammatory Liver Injury in Mice.Front Immunol. 2020 Jun 3;11:1157. doi: 10.3389/fimmu.2020.01157. eCollection 2020. Front Immunol. 2020. PMID: 32670276 Free PMC article.
-
The receptor for advanced glycation end products is required for β-catenin stabilization in a chemical-induced asthma model.Br J Pharmacol. 2016 Sep;173(17):2600-13. doi: 10.1111/bph.13539. Epub 2016 Jul 27. Br J Pharmacol. 2016. PMID: 27332707 Free PMC article.
-
Diabetes induces hepatocyte pyroptosis by promoting oxidative stress-mediated NLRP3 inflammasome activation during liver ischaemia and reperfusion injury.Ann Transl Med. 2020 Jun;8(12):739. doi: 10.21037/atm-20-1839. Ann Transl Med. 2020. PMID: 32647664 Free PMC article.
References
-
- Kim WR, Smith JM, Skeans MA, Schladt DP, Schnitzler MA, Edwards EB et al. OPTN/SRTR 2012 Annual Data Report: liver. Am J Transplant 2014;14 Suppl 1:69–96. - PubMed
-
- Petrides AS, Vogt C, Schulze-Berge D, Matthews D, Strohmeyer G. Pathogenesis of glucose intolerance and diabetes mellitus in cirrhosis. Hepatology 1994;19(3):616–627. - PubMed
-
- Zein NN, Abdulkarim AS, Wiesner RH, Egan KS, Persing DH. Prevalence of diabetes mellitus in patients with end-stage liver cirrhosis due to hepatitis C, alcohol, or cholestatic disease. J Hepatol 2000;32(2):209–217. - PubMed
-
- John PR, Thuluvath PJ. Outcome of liver transplantation in patients with diabetes mellitus: a case-control study. Hepatology 2001;34(5):889–895. - PubMed
-
- Shields PL, Tang H, Neuberger JM, Gunson BK, McMaster P, Pirenne J. Poor outcome in patients with diabetes mellitus undergoing liver transplantation. Transplantation 1999;68(4):530–535. - PubMed
Publication types
MeSH terms
Substances
Grants and funding
LinkOut - more resources
Full Text Sources
Medical
