

Sound Pressure Levels in 2 Veterinary Intensive Care Units
- PMID: 26113147
- PMCID: PMC4895367
- DOI: 10.1111/jvim.13574
Sound Pressure Levels in 2 Veterinary Intensive Care Units
Abstract
Background: Intensive care units (ICUs) in human hospitals are consistently noisy environments with sound levels sufficient to substantially decrease sleep quality. Sound levels in veterinary ICUs have not been studied previously, but environmental sound has been shown to alter activity in healthy dogs.
Hypothesis: Veterinary ICUs, like those in human medicine, will exceed international guidelines for hospital noise.
Animals: NA.
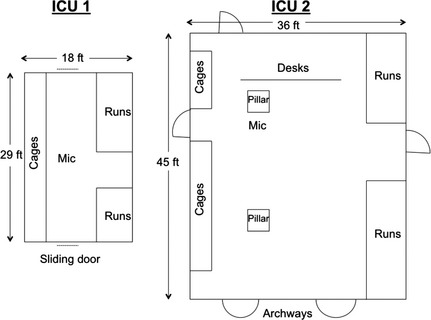
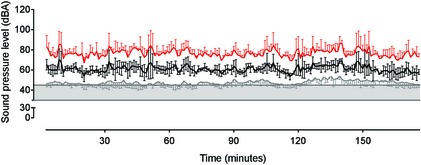
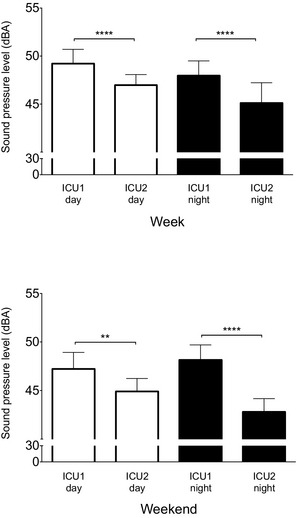
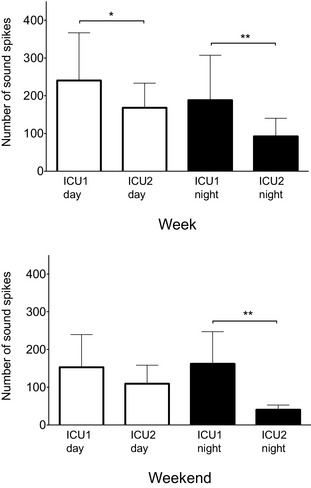
Methods: Prospective, observational study performed consecutively and simultaneously over 4 weeks in 2 veterinary ICUs. Conventional A-weighted sound pressure levels (equivalent continuous level [a reflection of average sound], the sound level that is exceeded 90% of the recording period time [reflective of background noise], and maximum sound levels) were continuously recorded and the number of spikes in sound >80 dBA were manually counted.
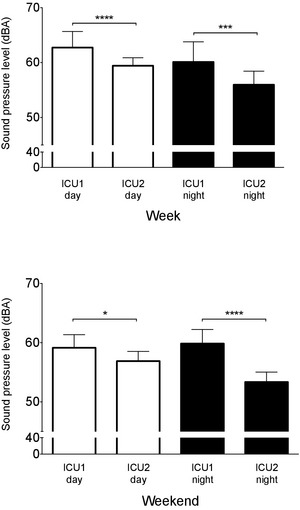
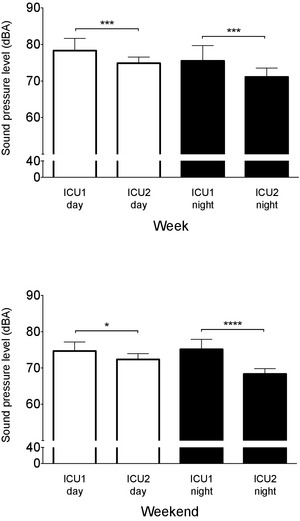
Results: Noise levels were comparable to ICUs in human hospitals. The equivalent continuous sound level was higher in ICU1 than in ICU2 at every time point compared, with greatest differences observed on week day (ICU1, 60.1 ± 3.7 dBA; ICU2, 55.9 ± 2.5 dBA, P < .001) and weekend nights (ICU1, 59.9 ± 2.4 dBA; ICU2, 53.4 ± 1.7 dBA, P < .0001) reflecting a 50% difference in loudness. Similar patterns were observed for the maximum and background noise levels. The number of sound spikes was up to 4 times higher in ICU1 (162.3 ± 84.9 spikes) than in ICU2 (40.4 ± 12.2 spikes, P = .001).
Conclusions and clinical importance: These findings show that sound in veterinary ICUs is loud enough to potentially disrupt sleep in critically ill veterinary patients.
Keywords: Critical care; Hospital soundscape; Noise; Sleep.
Copyright © 2015 The Authors. Journal of Veterinary Internal Medicine published by Wiley Periodicals, Inc. on behalf of the American College of Veterinary Internal Medicine.
Figures
References
-
- Everson CA. Functional consequences of sustained sleep deprivation in the rat. Behav Brain Res 1995;69:43–54. - PubMed
-
- Freedman NS, Gazendam J, Levan L, et al. Abnormal sleep/wake cycles and the effect of environmental noise on sleep disruption in the intensive care unit. Am J Respir Crit Care Med 2001;163:451–457. - PubMed
-
- Freedman NS, Kotzer N, Schwab RJ. Patient perception of sleep quality and etiology of sleep disruption in the intensive care unit. Am J Respir Crit Care Med 1999;159:1155–1162. - PubMed
Publication types
MeSH terms
LinkOut - more resources
Full Text Sources
Other Literature Sources
Medical
