

Assembly of Slx4 signaling complexes behind DNA replication forks
- PMID: 26113155
- PMCID: PMC4557669
- DOI: 10.15252/embj.201591190
Assembly of Slx4 signaling complexes behind DNA replication forks
Abstract
Obstructions to replication fork progression, referred to collectively as DNA replication stress, challenge genome stability. In Saccharomyces cerevisiae, cells lacking RTT107 or SLX4 show genome instability and sensitivity to DNA replication stress and are defective in the completion of DNA replication during recovery from replication stress. We demonstrate that Slx4 is recruited to chromatin behind stressed replication forks, in a region that is spatially distinct from that occupied by the replication machinery. Slx4 complex formation is nucleated by Mec1 phosphorylation of histone H2A, which is recognized by the constitutive Slx4 binding partner Rtt107. Slx4 is essential for recruiting the Mec1 activator Dpb11 behind stressed replication forks, and Slx4 complexes are important for full activity of Mec1. We propose that Slx4 complexes promote robust checkpoint signaling by Mec1 by stably recruiting Dpb11 within a discrete domain behind the replication fork, during DNA replication stress.
Keywords: DNA damage response; Dpb11; Slx4; checkpoint kinase; replication stress.
© 2015 The Authors.
Figures
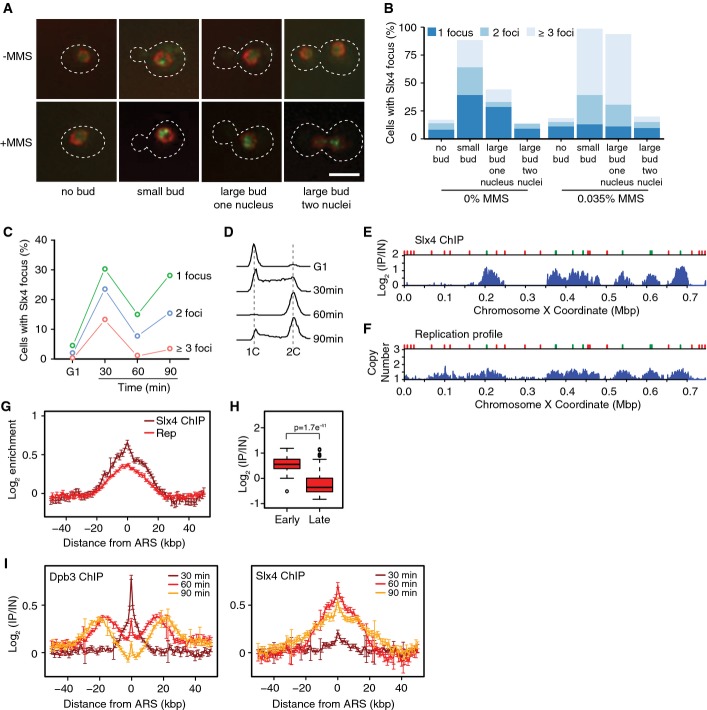
Intracellular localization of Slx4-GFP in logarithmic phase cells, either untreated or treated for 90 min with 0.035% MMS. Examples of cells with the indicated morphologies are shown. The nuclear periphery is marked with Nup49-RFP, the outline of the cells is indicated by the dashed line, and the scale bar indicates 5 μm.
Slx4-GFP foci were quantified in logarithmic phase cells, either untreated or treated for 90 min with 0.035% MMS. Cells with each of the indicated morphologies were assessed, and the fraction of cells with each morphology that had 1, 2, or ≥ 3 foci is plotted. 477 (-MMS) and 619 (+MMS) cells were evaluated in the experiment shown, which is a representative of two replicates.
Cells were arrested in G1 and released synchronously into the cell cycle. The fraction of cells with 1, 2, or ≥ 3 Slx4-GFP foci was quantified at the indicated times, and the average of three replicates is plotted.
The DNA contents of cells from the samples in (C) were measured by flow cytometry and are plotted as histograms. The positions of 1C and 2C DNA contents are indicated.
ChIP-seq analysis was performed following synchronous release of SLX4-FLAG cells into S phase in the presence of 0.035% MMS for 60 min. Slx4 ChIP enrichment scores on chromosome 10 are shown. Early origins are indicated by green bars and late origins by red bars.
The replication profile compares the relative copy number of DNA sequences in the input sample from the SLX4-FLAG cells released into S phase in the presence of 0.035% MMS for 60 min to a DNA sample prepared from G1-arrested wild-type cells. Copy number along chromosome 10 is plotted.
The median (± standard error) Slx4 ChIP enrichment score and replication profile (Rep) across n = 108 early-firing origins, in wild-type cells, are plotted.
The distributions of Slx4 ChIP enrichment scores at early- and late-firing origins genome-wide are shown as a boxplot. The median is indicated by the horizontal bar, the box spans the first through third quartiles, the whiskers extend to the last data points within 1.5 times the interquartile range, and outliers are plotted as circles. The distributions were compared using the Wilcoxon rank-sum test.
ChIP-seq analysis was performed on DPB3-FLAG and SLX4-FLAG cells at 30, 60, and 90 min following synchronous release into S phase in the presence of 0.035% MMS. The median (± standard error) Dpb3 (left) and Slx4 (right) ChIP enrichment score across n = 108 early-firing origins are plotted.
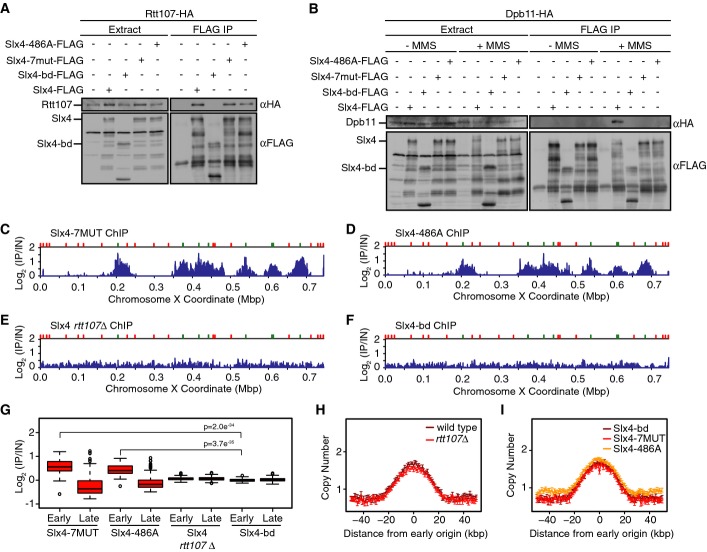
A, B Analysis of Slx4, Slx4-bd, Slx4-7MUT, and Slx4-486A binding to Rtt107 (A) and Dpb11 (B) by co-immunoprecipitation. The input extract and the anti-Flag immunoprecipitates are shown. Immunoblots were probed with anti-HA or anti-Flag antibodies, as indicated. Binding to Dpb11 was tested with and without treatment of asynchronous cells with 0.035% MMS for 2 h.
C–F ChIP-seq analysis of Slx4 was performed following synchronous release of (C) slx4-7MUT-FLAG, (D) slx4-486A-FLAG, (E) SLX4-FLAG rtt107Δ, and (F) slx4-bd-FLAG cells into S phase in the presence of 0.035% MMS for 60 min. Slx4 ChIP enrichment scores on chromosome 10 are shown.
G The distributions of Slx4 ChIP enrichment scores at early- and late-firing origins genome-wide are shown as a boxplot for slx4-7MUT-FLAG, slx4-486A-FLAG, SLX4-FLAG rtt107Δ, and slx4-bd-FLAG cells. The median is indicated by the horizontal bar, the box spans the first through third quartiles, the whiskers extend to the last data points within 1.5 times the interquartile range, and outliers are plotted as circles. The distributions at early origins were compared using the Wilcoxon rank-sum test. The P-values for Slx4-7MUT vs Slx4-bd and Slx4-486A vs Slx4-bd are shown. The P-values for Slx4-7MUT and Slx4-486A vs Slx4 in rtt107Δ were similar, < 10−33.
H, I The median (± standard error) copy number across n = 108 early-firing origins is plotted for wild-type and rtt107Δ cells (H) and for slx4-7MUT, slx4-486A, and slx4-bd cells (I) following synchronous release into S phase in the presence of 0.035% MMS for 60 min.
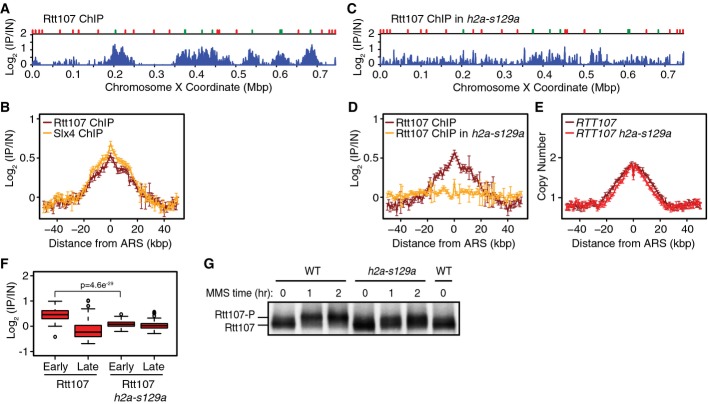
ChIP-seq analysis was performed following synchronous release of RTT107-FLAG cells into S phase in the presence of 0.035% MMS for 60 min. Rtt107 ChIP enrichment scores on chromosome 10 are shown. Early origins are indicated by green bars and late origins by red bars.
The median (± standard error) Rtt107 ChIP enrichment scores are plotted with the median (± standard error) Slx4 ChIP enrichment scores across n = 108 early-firing origins, in wild-type cells.
ChIP-seq analysis was performed following synchronous release of RTT107-FLAG h2a-s129a cells into S phase in the presence of 0.035% MMS for 60 min. Rtt107 ChIP enrichment scores on chromosome 10 are shown.
The median (± standard error) Rtt107 ChIP enrichment scores are plotted across n = 108 early-firing origins, for wild-type and h2a-s129a cells.
The median (± standard error) replication profile across n = 108 early-firing origins is plotted for wild-type and h2a-s129a cells.
The distributions of Rtt107 ChIP enrichment scores at early- and late-firing origins genome-wide are shown as boxplots. The median is indicated by the horizontal bar, the box spans the first through third quartiles, the whiskers extend to the last data points within 1.5 times the interquartile range, and outliers are plotted as circles. The distributions were compared using the Wilcoxon rank-sum test.
Immunoblot analysis of Rtt107-FLAG in wild-type and h2a-s129a cells before and after treatment of asynchronous cultures with 0.035% MMS for the indicated times.
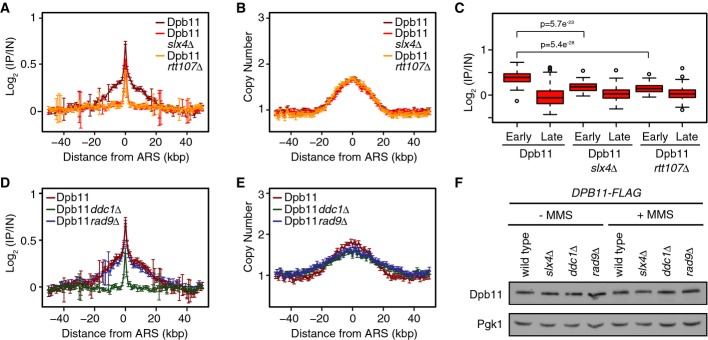
A, B The median (± standard error) Dpb11 ChIP enrichment scores (A) and DNA copy number (B) across n = 108 early-firing origins in wild-type, slx4Δ, and rtt107Δ cells are plotted.
C The distributions of Dpb11 ChIP enrichment scores at early- and late-firing origins genome-wide are shown as a boxplot. The median is indicated by the horizontal bar, the box spans the first through third quartiles, the whiskers extend to the last data points within 1.5 times the interquartile range, and outliers are plotted as circles. The distributions at early origins were compared using the Wilcoxon rank-sum test.
D, E The median (± standard error) Dpb11 ChIP enrichment scores (D) and replication profile (E) across n = 108 early-firing origins in wild-type, ddc1Δ, and rad9Δ cells are plotted.
F The level of Dpb11 was assessed by immunoblot analysis of the indicated strains, in the presence and absence of 0.035% MMS. Dbp11-FLAG was detected with an anti-FLAG antibody. Pgk1 levels were assessed as a loading control.
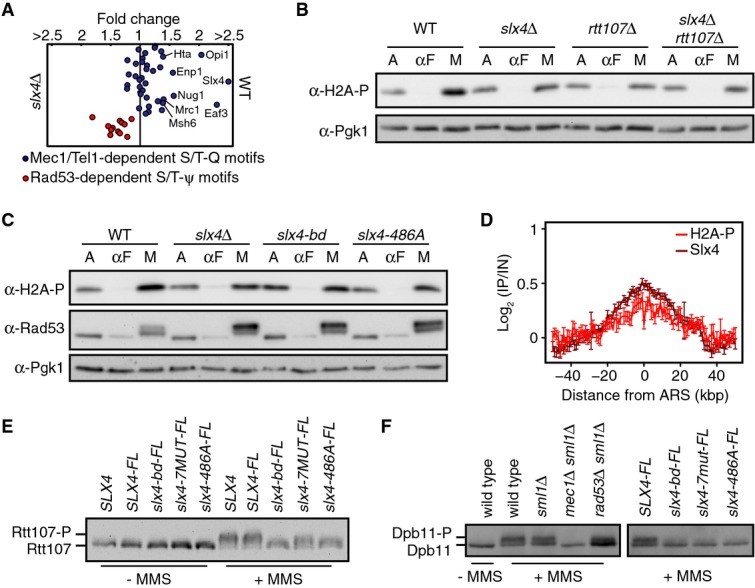
Quantitative phosphoproteome analysis of the relative abundance of known Mec1 targets in wild-type and slx4Δ cells following growth for 1 h in 0.01% MMS. Mec1-/Tel1-dependent Rad53-independent (blue circles; S/T-Q motifs) and Rad53-dependent (red circles; S/T-ψ motifs) phospho events are plotted as the wild-type: slx4Δ abundance ratio, on a linear scale.
Immunoblot analysis of H2A-S129 phosphorylation (H2A-S129-P) in the indicated strains. Cultures were sampled during asynchronous growth (A), after G1 arrest with α-factor (αF), and after release into S phase in 0.035% MMS for 60 min (M). Immunoblots were probed with anti-H2A-S129-P antibodies and with anti-Pgk1 antibodies (as a loading control).
Immunoblot analysis of H2A-S129 phosphorylation and Rad53 phosphorylation in the indicated strains. Cultures were treated as in (B), with anti-Pgk1 staining of the immunoblot used as the loading control.
The median (± standard error) H2A-S129-P and Slx4 ChIP enrichment score across n = 108 early-firing origins in wild-type cells is plotted.
Immunoblot analysis of Rtt107 phosphorylation in strains expressing the indicated Slx4 proteins. Cells were treated with or without 0.035% MMS for 2 h. The epitope-tagged Rtt107 was detected with anti-HA antibodies.
Immunoblot analysis of Dpb11 phosphorylation in the indicated strains. Cells were treated with or without 0.035% MMS for 2 h. The immunoblot was probed with anti-HA antibodies to detect the HA epitope-tagged Dpb11 present in all strains.
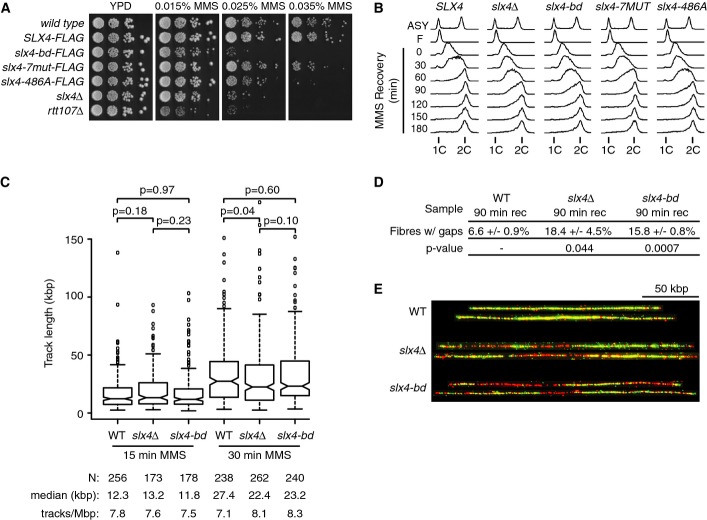
A The indicated strains were serially diluted ten-fold, spotted on YPD or YPD + MMS plates, and grown at 30°C for 3 days.
B Cells were arrested in G1 with α-factor, released synchronously into S phase in the presence of 0.035% MMS for 1 h, and allowed to recover in fresh media for 3 h. Samples were taken for analysis by flow cytometry at the indicated times.
C–E Wild-type, slx4Δ, and slx4-bd cells expressing thymidine kinase were arrested in G1 and released into S phase in the presence of 400 μg/ml BrdU and 0.035% MMS. (C) Samples were collected at 15 and 30 min for BrdU track length analysis. The distributions of BrdU track lengths are displayed as boxplots. The median is indicated by the horizontal bar, the box spans the first through third quartiles, the whiskers extend to the last data points within 1.5 times the interquartile range, and outliers are plotted as circles. Median BrdU track length is shown, and P-values were determined using a Mann–Whitney U-test. (D) Following 60 min of treatment, MMS was washed out and cells were allowed to recover in fresh media containing BrdU for 90 min before samples were taken for BrdU gap analysis. Mean values of 3 independent experiments and standard error are shown for the percentage of fibers with gaps following recovery from MMS. At least 190 fibers were analyzed for each replicate, and the P-values were determined using a t-test. (E) Representative DNA fibers extracted from different micrographs and assembled using Photoshop are shown. Green is BrdU-labeled nascent DNA, and red is unlabeled parental DNA. The scale bar is 50 kbp.
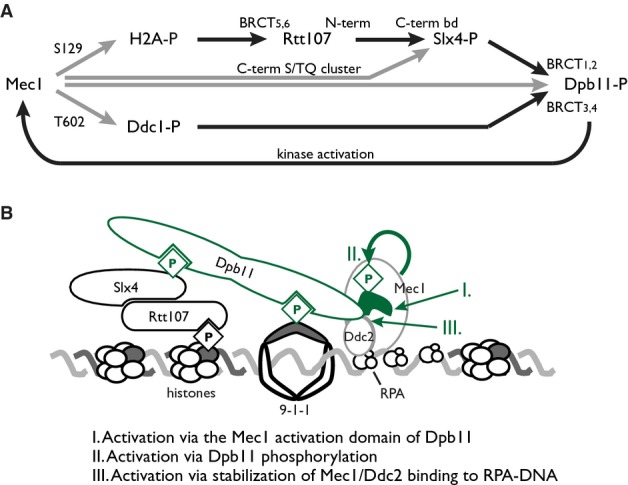
Mec1 phosphorylation of H2A serine 129 nucleates assembly of Slx4 complexes by providing a binding site for the C-terminal BRCT pair of Rtt107. Slx4 binds Rtt107 constitutively via its C-terminal Rtt107 binding domain. Phosphorylation of Slx4, by Cdk and Mec1, creates binding sites for the N-terminal BRCT pair of Dpb11, whereas the C-terminal BRCT pair binds Ddc1 phosphorylated on threonine 602 by Mec1. Engagement of both Dpb11 BRCT pairs results in stable complex formation distal to the MMS-stressed replication fork, and promotes Mec1 kinase activity, resulting in a positive feedback loop that amplifies Mec1 signaling. Phosphorylations are indicated by gray lines, and protein–protein interactions are indicated by black lines.
A model of Slx4 complex assembly, with three possible modes of Mec1 activation indicated.
References
-
- Alcasabas AA, Osborn AJ, Bachant J, Hu F, Werler PJ, Bousset K, Furuya K, Diffley JF, Carr AM, Elledge SJ. Mrc1 transduces signals of DNA replication stress to activate Rad53. Nat Cell Biol. 2001;3:958–965. - PubMed
-
- van Attikum H, Fritsch O, Hohn B, Gasser SM. Recruitment of the INO80 complex by H2A phosphorylation links ATP-dependent chromatin remodeling with DNA double-strand break repair. Cell. 2004;119:777–788. - PubMed
-
- Bellay J, Atluri G, Sing TL, Toufighi K, Costanzo M, Ribeiro PS, Pandey G, Baller J, VanderSluis B, Michaut M, Han S, Kim P, Brown GW, Andrews BJ, Boone C, Kumar V, Myers CL. Putting genetic interactions in context through a global modular decomposition. Genome Res. 2011;21:1375–1387. - PMC - PubMed
Publication types
MeSH terms
Substances
Grants and funding
LinkOut - more resources
Full Text Sources
Other Literature Sources
Molecular Biology Databases
