Clinical Trial
. 2015 Sep;100(9):1189-98.
doi: 10.3324/haematol.2014.114967. Epub 2015 Jun 25.

Deregulation of Fas ligand expression as a novel cause of autoimmune lymphoproliferative syndrome-like disease

Affiliations
Clinical Trial

Deregulation of Fas ligand expression as a novel cause of autoimmune lymphoproliferative syndrome-like disease

Schafiq Nabhani et al. Haematologica. 2015 Sep.

Abstract

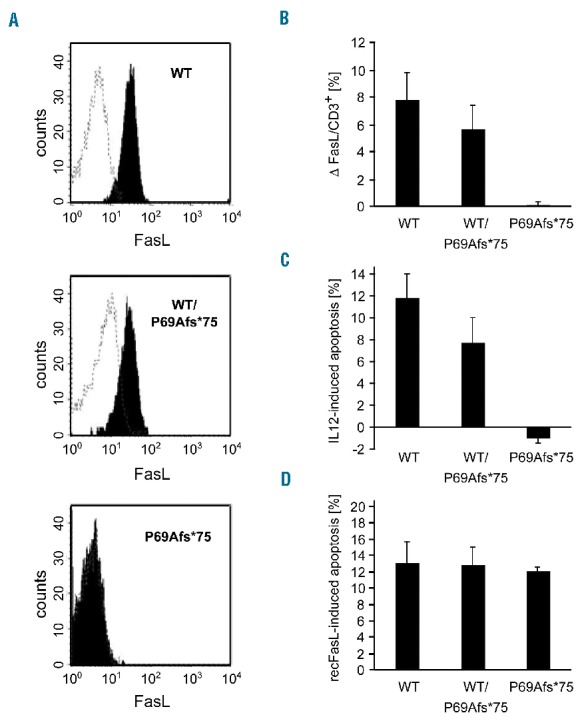
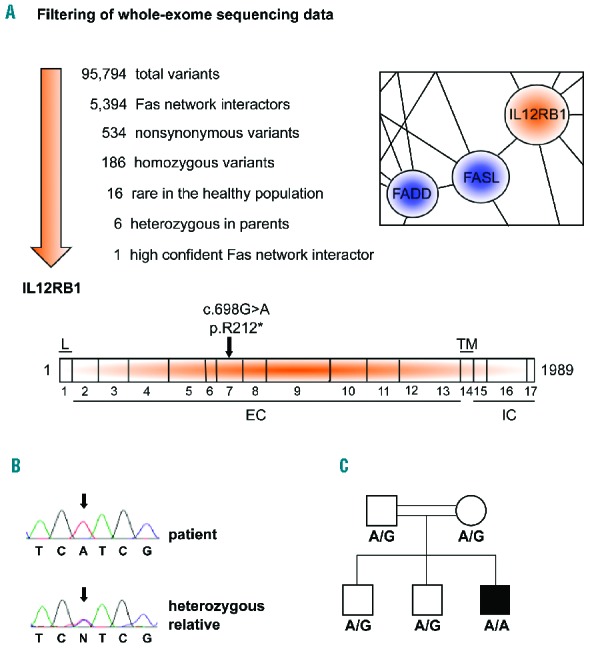
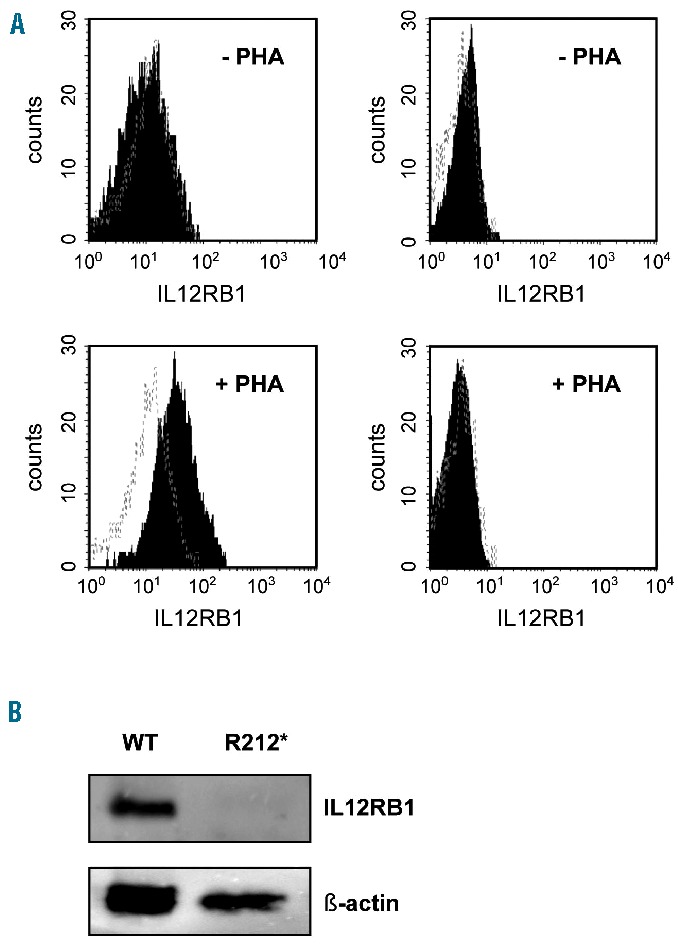
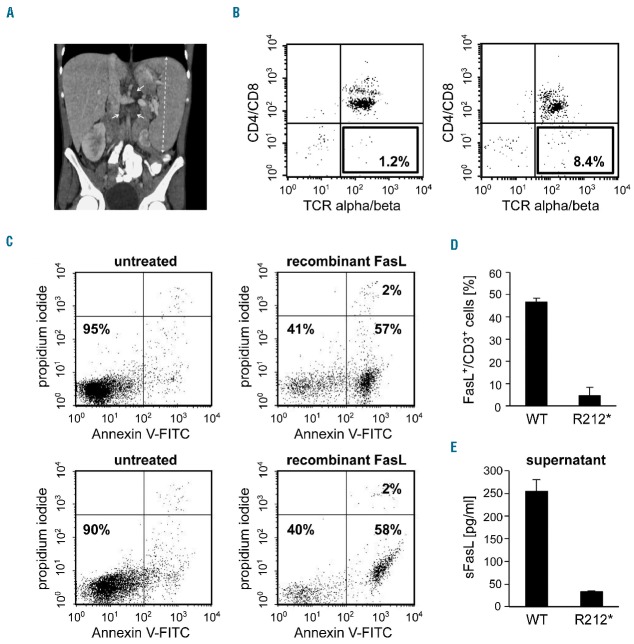
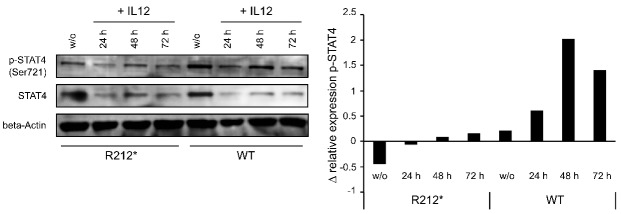
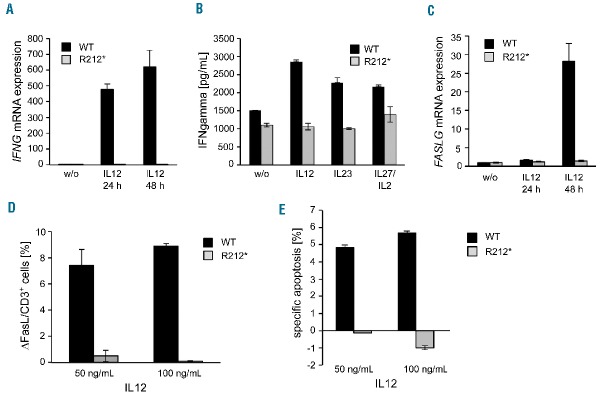
Autoimmune lymphoproliferative syndrome is frequently caused by mutations in genes involved in the Fas death receptor pathway, but for 20-30% of patients the genetic defect is unknown. We observed that treatment of healthy T cells with interleukin-12 induces upregulation of Fas ligand and Fas ligand-dependent apoptosis. Consistently, interleukin-12 could not induce apoptosis in Fas ligand-deficient T cells from patients with autoimmune lymphoproliferative syndrome. We hypothesized that defects in the interleukin-12 signaling pathway may cause a similar phenotype as that caused by mutations of the Fas ligand gene. To test this, we analyzed 20 patients with autoimmune lymphoproliferative syndrome of unknown cause by whole-exome sequencing. We identified a homozygous nonsense mutation (c.698G>A, p.R212*) in the interleukin-12/interleukin-23 receptor-component IL12RB1 in one of these patients. The mutation led to IL12RB1 protein truncation and loss of cell surface expression. Interleukin-12 and -23 signaling was completely abrogated as demonstrated by deficient STAT4 phosphorylation and interferon γ production. Interleukin-12-mediated expression of membrane-bound and soluble Fas ligand was lacking and basal expression was much lower than in healthy controls. The patient presented with the classical symptoms of autoimmune lymphoproliferative syndrome: chronic non-malignant, non-infectious lymphadenopathy, splenomegaly, hepatomegaly, elevated numbers of double-negative T cells, autoimmune cytopenias, and increased levels of vitamin B12 and interleukin-10. Sanger sequencing and whole-exome sequencing excluded the presence of germline or somatic mutations in genes known to be associated with the autoimmune lymphoproliferative syndrome. Our data suggest that deficient regulation of Fas ligand expression by regulators such as the interleukin-12 signaling pathway may be an alternative cause of autoimmune lymphoproliferative syndrome-like disease.


Figures

Figure 1.
Figure 1.
(A) Premature protein truncation due to a homozygous insertion of one base pair in exon 1 of FASLG (g.172628545insT, p.P69Afs*75) leads to loss of FasL expression on the surface of CD3+ cells (lower panel). A heterozygous carrier (middle panel) expresses similar FasL levels as the wild-type control (upper panel). Representative flow cytometric measurements of FasL expression on primary T cells after activation with phytohemagglutinin (7 μg/mL) in the presence of IL2 (30 U/mL) for 4 days are shown. (B) Individuals carrying the homozygous FASLG mutation (g.172628545insT, p.P69Afs*75) are deficient in upregulation of FasL in response to IL12. Primary T cells of a healthy wild-type control, a heterozygous carrier and a patient with the homozygous FASLG (g.172628545insT, p.P69Afs*75) mutation were activated as decribed in (A) and treated with 100 ng/mL IL12 or left untreated for 2 further days. FasL expression on CD3+ cells was measured employing flow cytometry. The percentage of FasL-expressing CD3+ cells specifically induced in IL12-treated compared to untreated cells is shown. (C) Cultivated patient‘s T cells are resistant to apoptosis induced by stimulation with IL12. T cells were activated as in (A). Apoptosis was induced by incubation with 100 ng/mL IL12 for 2 days and measured employing flow cytometric detection of annexin V-FITC and pro-pidium iodide. The difference in the apoptosis rate compared to that of an untreated control is depicted. Specific apoptosis ranged from 4–12% in the healthy controls between comparable experiments and was absent in the patient’s cells. (D) T cells were activated by phytohemagglutinin/IL2 treatment as described in (A). Fas receptor-mediated apoptosis was triggered by application of 100 ng/mL optimized and pre-oligomerized recombinant FasL for 16 h and apoptosis was measured as in (C). In (B–D) mean values and standard deviations of representative experiments repeated at least three times and carried out in duplicate are shown. Similar results were obtained using samples from two individuals with homozygous FASLG (g.172628545insT, p.P69Afs*75) mutation and five wild-type controls.
Figure 2.
Figure 2.
Identification of a homozygous stop mutation in the IL12RB1 gene in a patient of the analyzed ALPS cohort. (A) Left panel: Overview of the strategy employed to filter whole-exome sequencing data resulting in IL12RB1 as the only candidate gene. Right panel: Detail of the network of interactions between members of the Fas pathway and IL12RB1. STRING 9.1 was used as a resource for protein-protein interactions. High confidence links (≥0.900) between proteins are shown. Members of the Fas signaling pathway are shown in blue. IL12RB1 as a gene product bearing a homozygous mutation in the patient but not in unaffected family members is shown in red. IL12RB1 was the only candidate showing a direct high confidence interaction with FasL. Lower panel: Schematic drawing of the IL12RB1 protein comprising 1989 nucleotides coding for 662 amino acids. The patient’s mutation led to a premature stop at codon 212 (exon 7, c.698G>A, p.R212*; L: leader peptide; EC: extracellular domain; TM: transmembrane domain; IC: intracellular domain). Exons are separated by vertical bars and numbered from 1 to 17. (B) Sanger sequencing of IL12RB1 confirmed a heterozygous mutation (c.698G>A) in the parents and the siblings and a homozygous mutation in the patient. Representative chromatograms of a heterozygous relative and the patient are shown. (C) Family pedigree of the affected patient. The parents and two siblings were asymptomatic, heterozygous carriers of the IL12RB1 c.698G>A mutation (genotype A/G). The patient represents the only affected, homozygous carrier of this mutation (genotype A/A). The parents are consanguineous.
Figure 3.
Figure 3.
The homozygous Il12RB1 mutation c.698G>A, p.R212* leads to absence of the receptor on the surface of the patient’s primary T cells. (A) Flow cytometric measurement of activation induced IL12RB1 surface expression on primary T lymphocytes of the patient (right panels) compared to a healthy control (left panels) after 4 days of treatment with phytohemagglutinin (PHA) and IL2 as described in Figure 1A (lower panels) or without activation by PHA (upper panels). (B) Immunoblot analysis of IL12RB1 protein expression. Protein extracts were prepared from PHA/IL2 activated, HVS-immortalized T lymphocytes from the patient and a healthy control. Western blot analysis was carried out employing an IL12RB1-specific antibody using β-actin as a loading control. (A, B) Results from representative experiments repeated three times are shown. Similar results were obtained using samples from three other wild-type controls.
Figure 4.
Figure 4.
The IL12RB1-deficient patient presented with classical clinical ALPS symptoms. (A) Computed tomography showing the patient’s splenomegaly and lymphadenopathy. Coronal reformatted image of the abdomen reveals significant splenomegaly (bidirectional dashed arrow) and enlarged retroperitoneal lymph nodes (arrows). (B) Elevated numbers of DNT cells (TCRα/β+, CD4, CD8) in the peripheral blood of the patient (right panel, lower right quadrant) compared to a healthy control (left panel). CD3+ cells are shown. DNT cells are indicated in the rectangles. (C) Cultured healthy and patient‘s primary T cells undergo apoptosis after stimulation with recombinant FasL indicating a defect upstream of the Fas receptor. T cells were activated as described in Figure 1A. Apoptosis was induced by incubation with 100 ng/mL recombinant FasL for 16 h. Apoptosis was measured as described in Figure 1C. Apototic cells are presented in the lower right quadrant. Left panel: untreated, right panel: treated cells, upper panels: healthy wild-type control cells, lower panels: patient’s cells. (D) Cell surface expression of membrane-bound FasL is lower in the patient’s lymphocytes. Cells were activated by phytohemagglutinin (PHA) and IL2 (as described in Figure 1A) and FasL surface staining of CD3+ T cells measured by flow cytometry on day 4. (E) Soluble FasL (sFasL) concentrations were measured by enzyme-linked immunosorbent assay. sFasL levels are lower in the supernatant of patient’s cells after 4 days of PHA/IL2 treatment compared to levels from control cells. (B–E) Results of representative experiments repeated at least three times. Mean values and standard deviations of duplicates are shown in (D, E). Similar results were obtained using samples from at least three independent wild-type controls.
Figure 5.
Figure 5.
IL12-mediated signaling is disturbed in the patient’s cells. Left panel: Phosphorylation of STAT4 in response to IL12 stimulation is abrogated in the patient. T cells of the patient and a healthy control were activated with phytohemagglutinin and IL2 as described in Figure 1A. Cell lysates were prepared after 24, 48 and 72 h of incubation with 200 ng/mL IL12 and untreated controls. Western blotting was carried out employing specific antibodies against total STAT4, phosphorylated STAT4 (serine 721) and β-actin as a loading control. Right panel: Densitometric measurement of signals derived by the western blot in the left panel carried out on a LAS-3000 equipped with LAS-3000 Image Reader software (Fujifilm, Düsseldorf, Germany). The difference of relative arbitrary units of pSTAT4 expression related to STAT4 expression is shown. The β-actin control was used to compensate differences due to loading. A representative result of two independent experiments is shown.
Figure 6.
Figure 6.
IL12-mediated signaling and apoptosis are disturbed in the patient’s cells. (A) Primary T cells of the patient and a healthy control were activated by phytohemagglutinin (PHA) and IL2 treatment and incubated with or without IL12 (100 ng/mL) for 24 or 48 h, respectively. RNA was then extracted and IFNG mRNA expression was measured by real-time polymerase chain reaction. The fold change compared to untreated controls is shown. GAPDH expression was used as an internal standard. (B) IFNγ production after treatment of immortalized T cells with 100 ng/mL IL12, IL23 or IL2/IL27, for 2 days was measured by enzyme-linked immunosorbent assay. IFNγ production in response to IL12 or IL23 is lacking in homozygous IL12RB1 c.698G>A, p.R212* mutated cells in contrast to control cells. IL2/IL27 treatment induces a slight increase in IFNγ production in both wild-type and IL12RB1 mutated T cells. (C) Primary T cells of the patient and a healthy control were activated by PHA/IL2 treatment and incubated with or without IL12 (100 ng/mL) for 2 days. RNA was then extracted and FASLG mRNA expression was measured by real-time polymerase chain reaction (fold-change compared to untreated control is presented). (D) IL12-induced upregulation of FasL expression was measured in T cells by flow cytometry after activation with PHA/IL2, and stimulation with IL12 (50 or 100 ng/mL, respectively) for a further 3 days. T cells of the patient lacked upregulation of FasL protein expression in response to IL12 compared to a healthy control. (E) Primary T cells derived from peripheral blood of the patient and a healthy control were activated and expanded by PHA/IL2 treatment and incubated with 50 or 100 ng/mL IL12, respectively, for 3 days. Apoptosis was measured as described in Figure 1C. The bar diagram represents apoptosis specifically induced by IL12 treatment compared to no treatment. (A–E) Results of representative experiments repeated at least three times. (A, C) Present mean values and standard deviation of triplicate experiments, (B, D, E) of duplicate experiments. Similar results were obtained using at least three wild-type controls.

Similar articles

Cited by

References

    1. Canale VC, Smith CH. Chronic lymphadenopathy simulating malignant lymphoma. J Pediatr. 1967;70(6):891–899. - PubMed
    1. Fleisher TA, Oliveira JB. Monogenic defects in lymphocyte apoptosis. Curr Opin Allergy Clin Immunol. 2013;12(6):609–615. - PubMed
    1. Fisher GH, Rosenberg FJ, Straus SE, et al. Dominant interfering Fas gene mutations impair apoptosis in a human autoimmune lymphoproliferative syndrome. Cell. 1995;81(6):935–946. - PubMed
    1. Rieux-Laucat F, Le Deist F, Hivroz C, et al. Mutations in Fas associated with human lymphoproliferative syndrome and autoimmunity. Science. 1995;268(5215):1347–1349. - PubMed
    1. Fischer U, Janicke RU, Schulze-Osthoff K. Many cuts to ruin: a comprehensive update of caspase substrates. Cell Death Differ. 2003;10(1):76–100. - PMC - PubMed

MeSH terms