. 2015 Jun 26:5:11652.
doi: 10.1038/srep11652.

Temperature affects the silicate morphology in a diatom

Affiliations

Temperature affects the silicate morphology in a diatom

N Javaheri et al. Sci Rep. .

Abstract

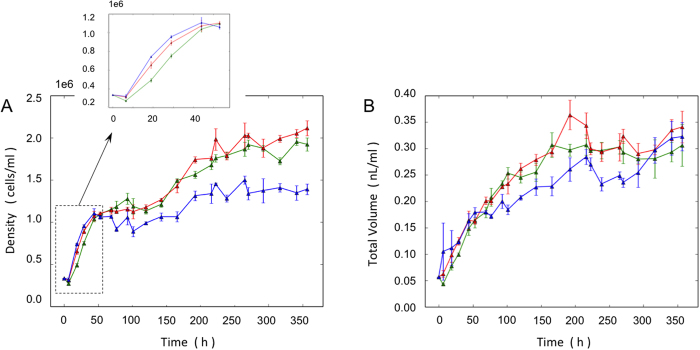
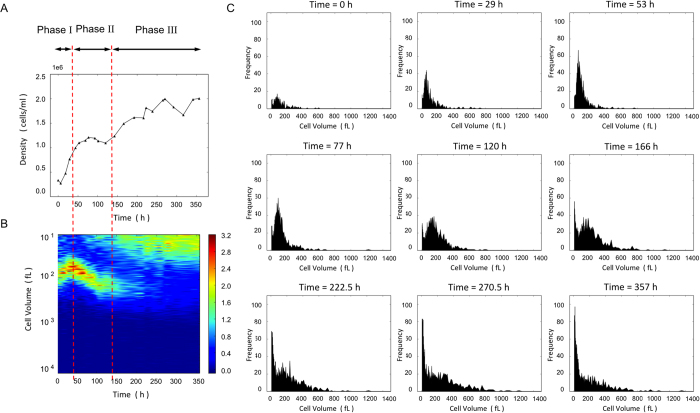
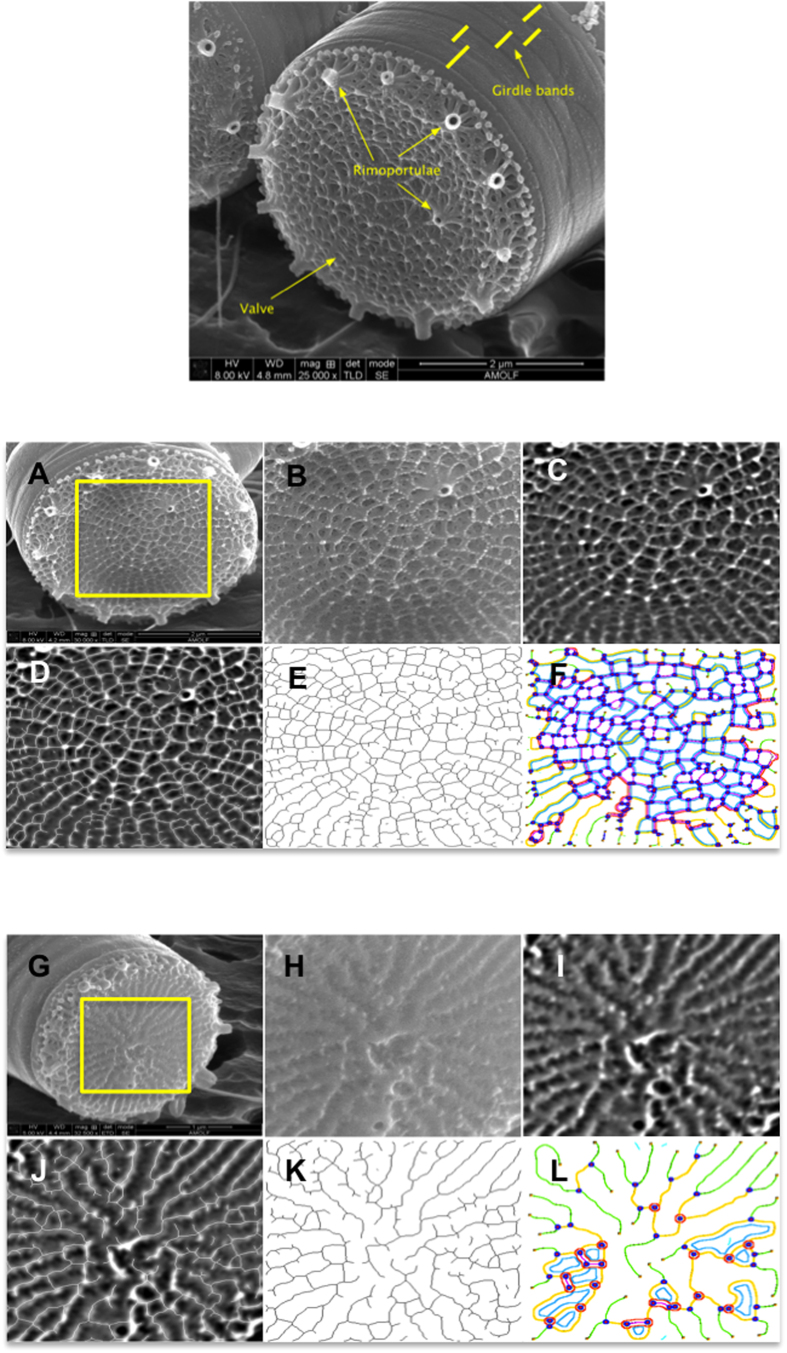
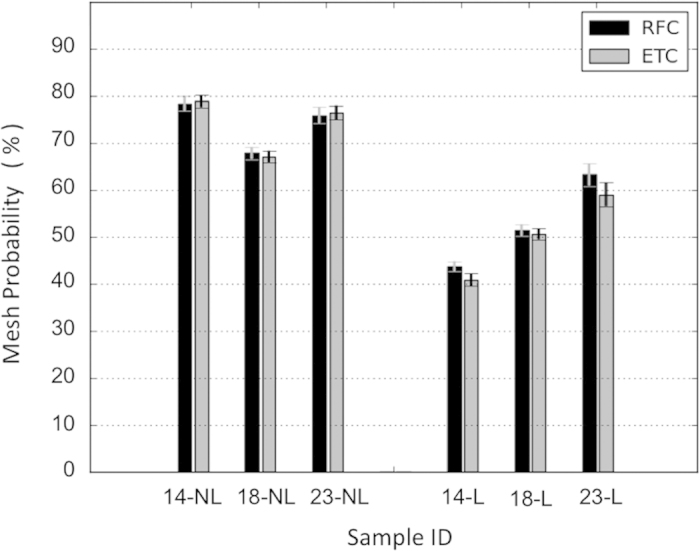
Silica deposition by diatoms, a common component of the phytoplankton, has attracted considerable interest given the importance in ecology and materials science. There has recently been a great deal of research into the biological control of biosilicifcation, yet the in vivo physical and chemical effects have not been quantitatively investigated. We have grown the marine diatom Thalassiosira pseudonana in batch culture at three temperatures (14°, 18°, and 23 °C). We observed three distinct temperature-dependent growth phases. The morphology of silica was investigated using scanning electron microscopy followed by image analysis and supervised learning. The silica in the valves of the same species showed different structures: a mesh-like pattern in silicon-rich cultures and a tree-like pattern in silicon-limited cultures. Moreover, temperature affected this silica pattern, especially in silicon-limited cultures. We conclude that cells grown at 14 °C and 18 °C divide more successfully in Si-limited conditions by developing a tree-like pattern (lower silicification).


Conflict of interest statement

The authors declare no competing financial interests.

Figures

Figure 1
Figure 1. Growth of cells at different temperatures:
14 °C (green), 18 °C (red) and 23 °C (blue). The mean and standard deviation is depicted. (A) Cell density. (B) Total cell volume per volume of seawater.
Figure 2
Figure 2. Cell density and cell size distribution of a culture grown at 14 °C.
(A) Cell density (B) Cell volume distribution. The color scale is the ratio of the number of cells with a specific volume compared to the total number of cells at each time point (measurement). The volume scale is logarithmic. The red lines separate three phases of growth. Non-limited Si/exponential growth phase, limited Si/synchronized phase and limited Si/regrowth phase. (C) Cell volume distribution of selected time points. In the first three frames increase in cell number is observed with the peak of cell volume distribution moving slightly to the left. In the 4th and 5th frame, the peak of the distribution moves to the right, meaning that most cells are growing in size. In the 6th frame (166 h) the peak of the cell volume distribution breaks and a new peak over small volume cells appears. In the last frame (357 h) the large volume peak has almost disappeared and most cells seem to possess a small volume but in a large range of sizes.
Figure 3
Figure 3. Analysis of silica morphology in diatom Thalassiosira pseudonana.
(Top) A SEM image of the geometry of silica. Girdle bands are located on the sides. Valves are located at end of the cells. Rimoportulae are tube-like structures on the perimeter, and sometimes in the central area, of valves. (Middle and Bottom) Image analysis of the valve structure. Middle: Mesh-type pattern, Bottom: Tree-type pattern. (A,G) SEM image of a diatom (B,H) cropped area around the center of valve (C,I) after applying filtering too large and too small structures (D,J) after applying tree finding by Angiogenesis analyzer plugin (E,K) the extracted tree (F,L) after analyzing and quantifying the tree.
Figure 4
Figure 4. Mesh probabilities (meshiness) for each experimental sample.
Cultures were grown at different temperatures (14, 18 or 23 degrees Celsius). Some are from a limited silicon population (L) and some are from a non-limited silicon population of diatoms (NL).

References

    1. Margalef R. Life-forms of phytoplankton as survival alternatives in an unstable environment. Oceanol. Acta. 1, 493–509 (1978).
    1. Parmesan C. Ecological and evolutionary responses to recent climate change. Annu. Rev. Ecol. Evol. Syst. 37, 637–669 (2006).
    1. Caperon J. & Meyer J. Nitrogen-limited growth of marine phytoplankton—II. Uptake kinetics and their role in nutrient limited growth of phytoplankton. Deep-Sea Res. 19, 619–632 Elsevier (1972).
    1. Massie T. M., Blasius B., Weithoff G., Gaedke U. & Fussmann G. F. Cycles, phase synchronization, and entrainment in single-species phytoplankton populations. PNAS. 107, 4236–4241 (2010). - PMC - PubMed
    1. Wischmeyer A. G., Del Amo Y., Brzezinski M. & Wolf-Gladrow D. A. Theoretical constraints on the uptake of silicic acid species by marine diatoms. Mar. Chem. 82, 13–29 (2003).

Publication types

LinkOut - more resources